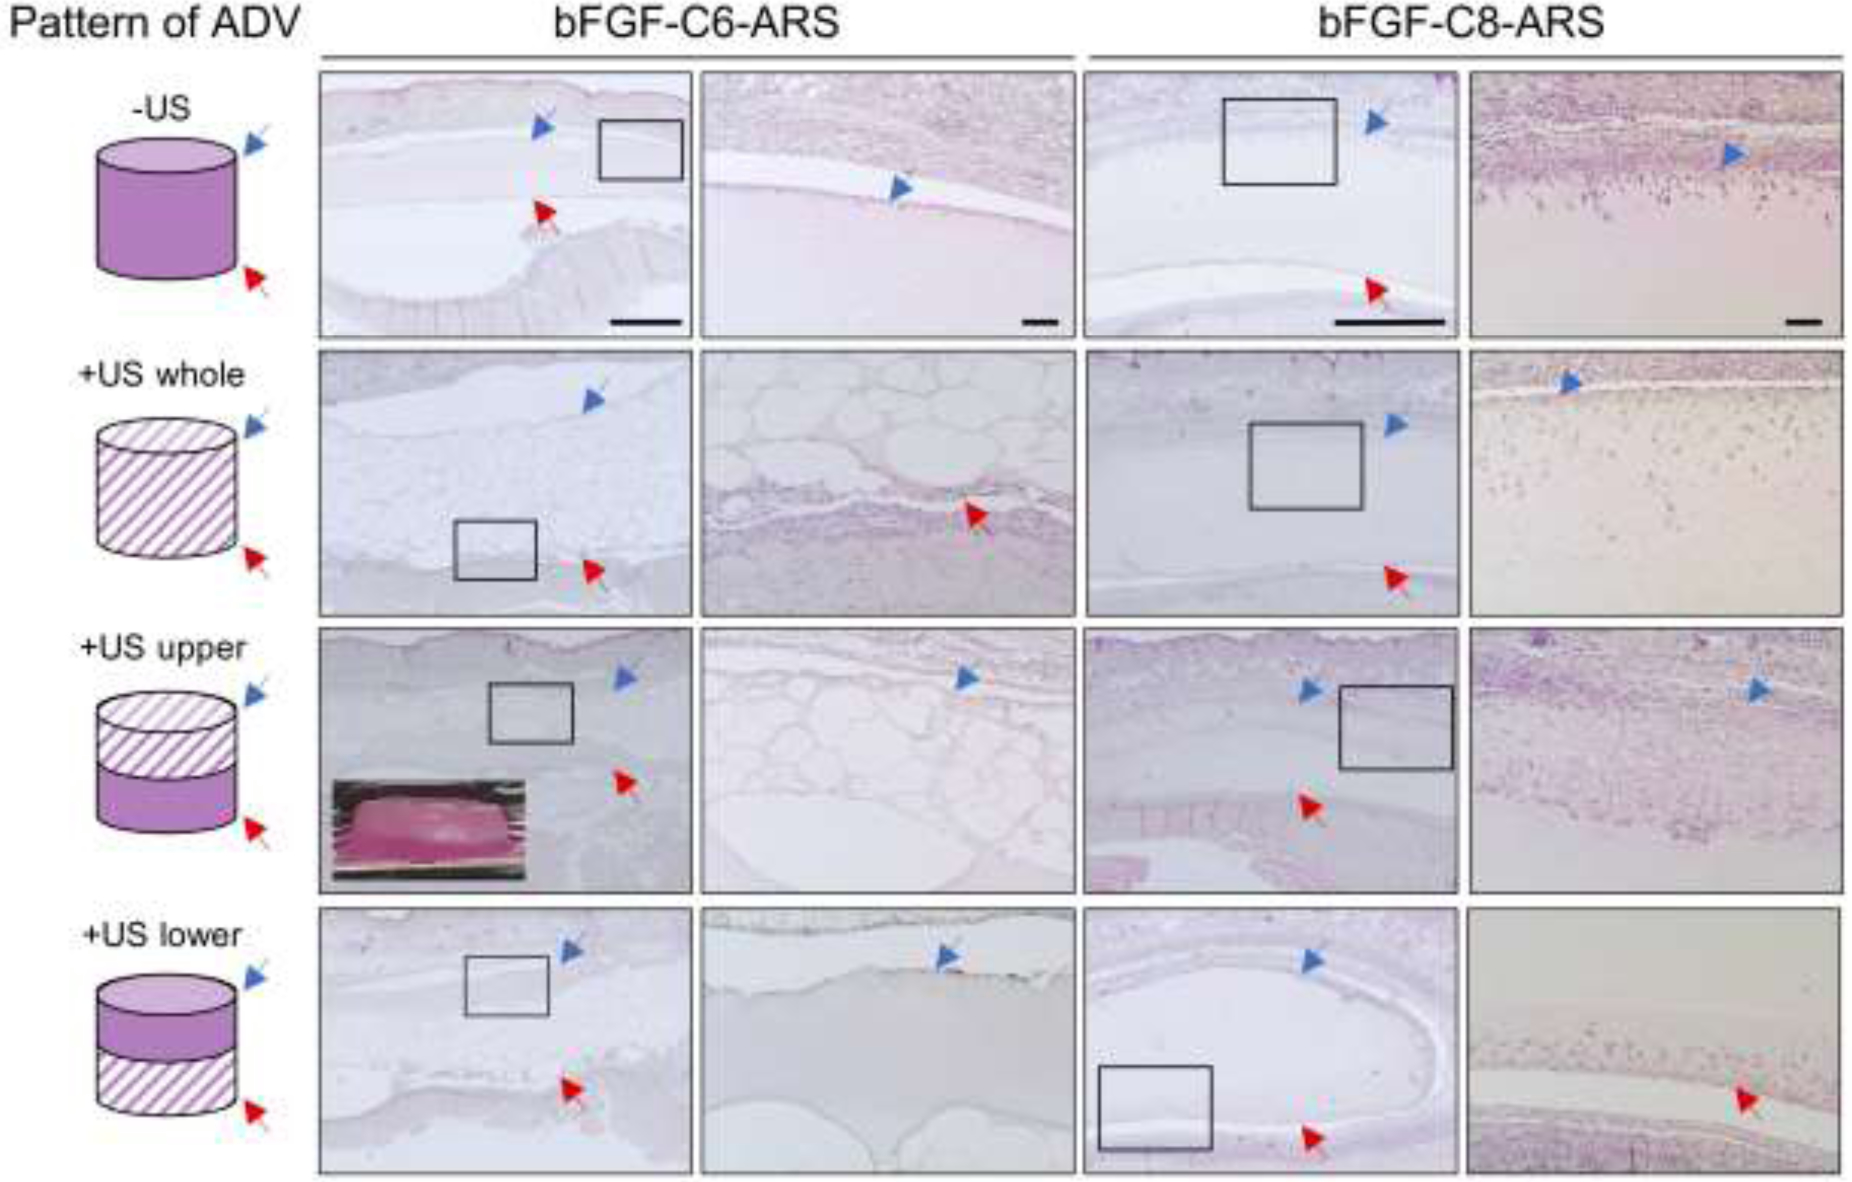
Figure 3.

ARSs with either bFGF-C6 or bFGF-C8 emulsion were polymerized and exposed ex situ to one of four different spatial patterns of 2.5 MHz US (far left column) prior to in vivo implantation on day 0. After 7 days, the ARSs and surrounding tissues were retrieved and stained with H&E, which enabled visualization of scaffold morphology and host cell migration. The blue arrow denotes the top interface of the ARS which was proximal to the overlying skin. The red arrow denotes the bottom interface of the ARS which was proximal to the underlying skeletal muscle. The second and fourth columns of images show zoomed-in panels from the first and third columns, respectively. Scale bars: 1 mm (columns 1 and 3) and 100 μm (columns 2 and 4). Inset: Image of an ARS exposed to the +US upper pattern. The height and diameter of the ARS is 4.2 mm and 9.5 mm, respectively.
