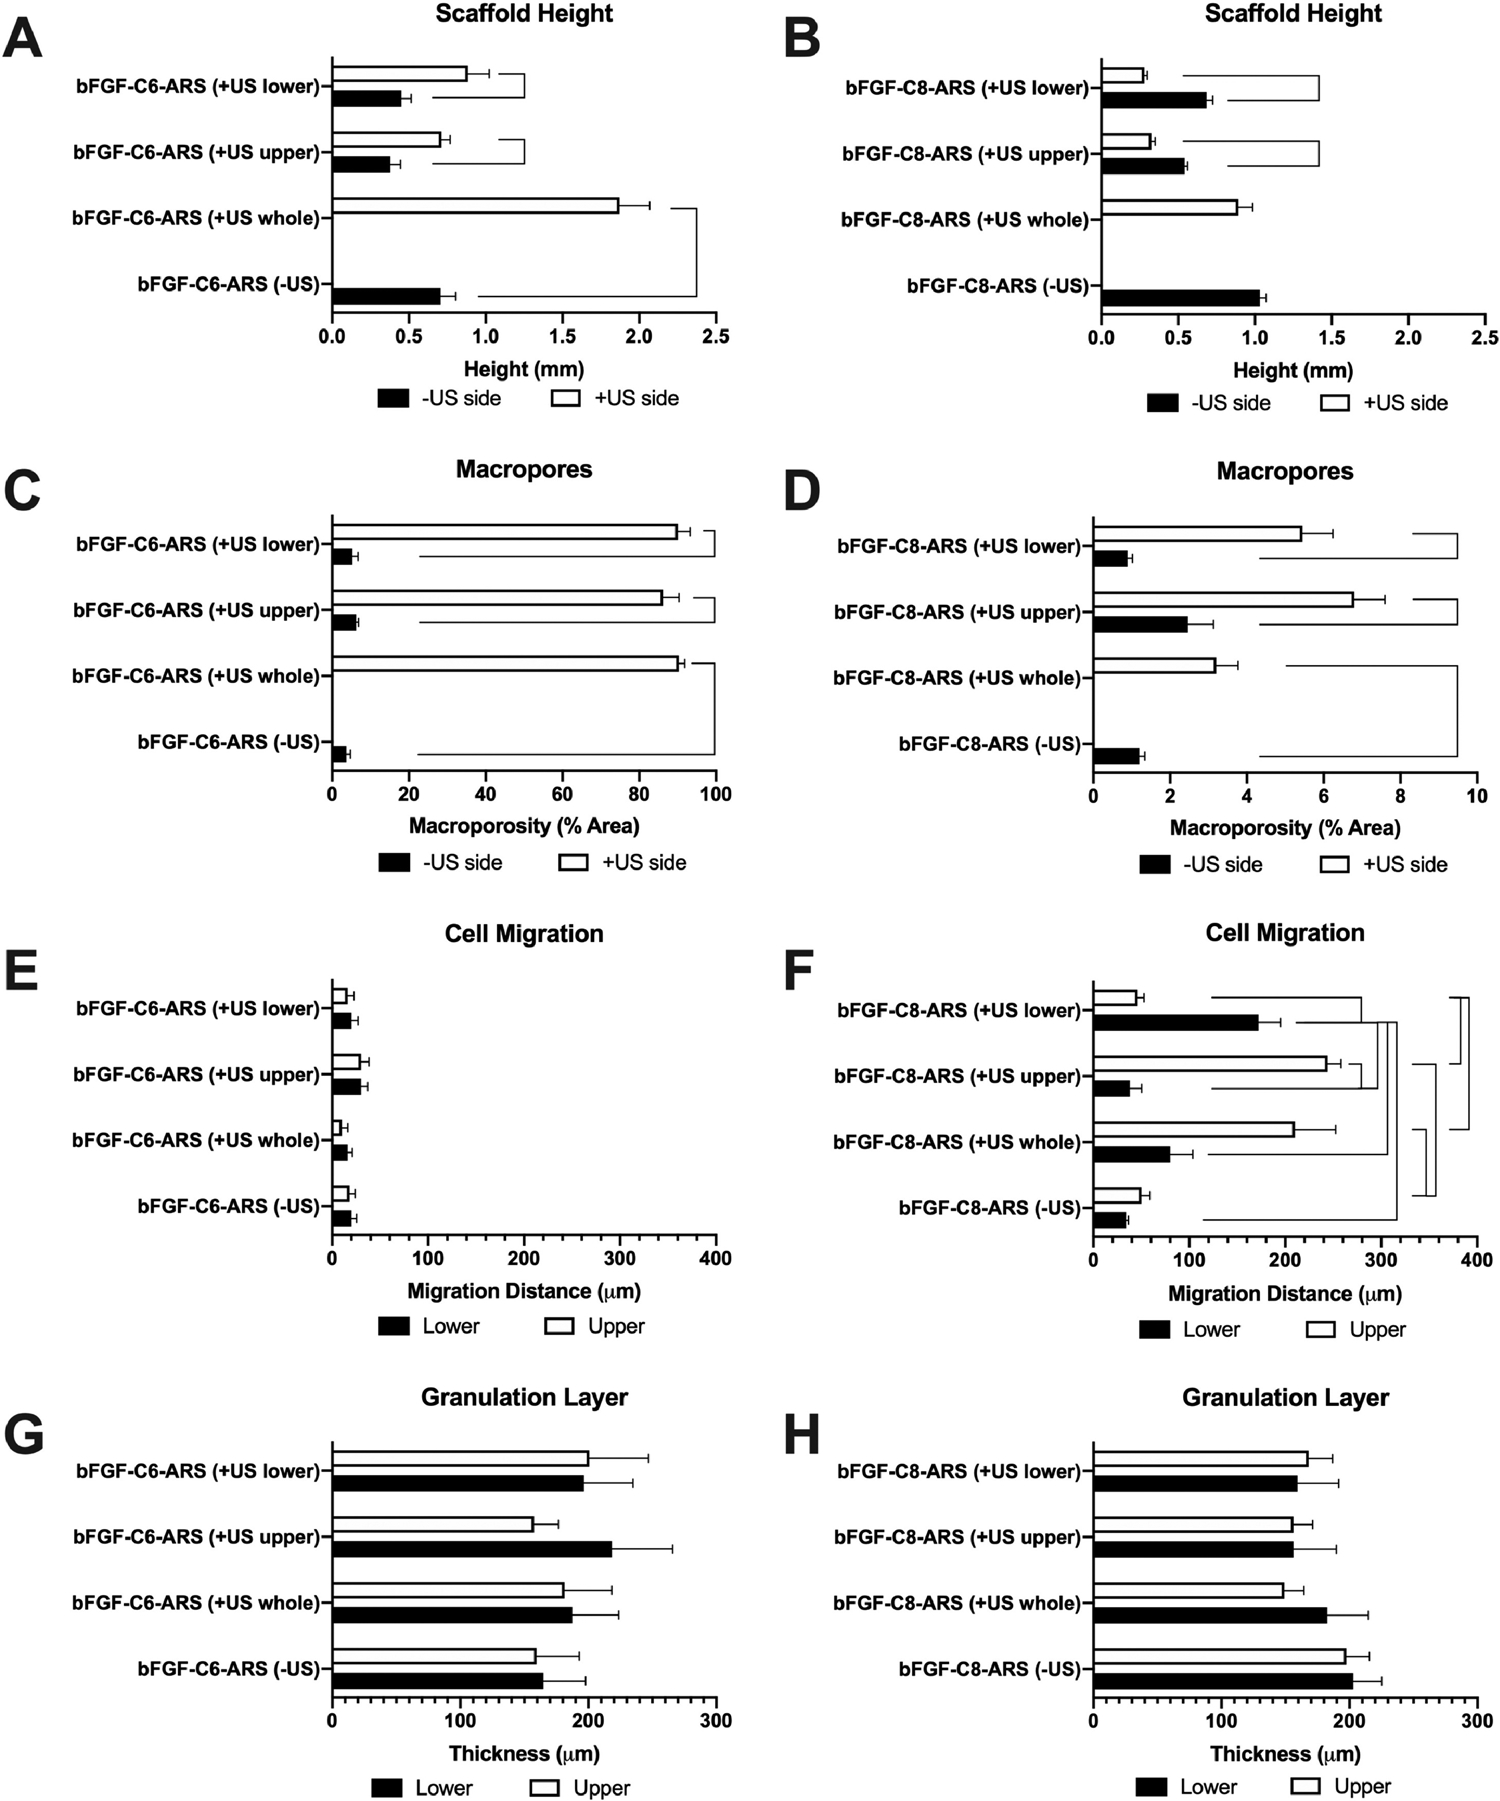
Figure 5.

After 7 days, the subcutaneously implanted ARSs and surrounding tissues were explanted and stained with H&E. The H&E images were quantitatively analyzed to determine (A,B) scaffold height, (C,D) the percent of macropores in the scaffold, (E,F) the distance of host cell migration into the scaffold, and (G,H) the thickness of the granulation tissue surrounding the scaffold. In panels A-D, the data are grouped according to US exposure. In panels E-H, the data are grouped based on the lower and upper regions of the ARS. Data are represented as mean ± standard error of the mean (N=5 per condition). Statistically significant differences (p < 0.01) are denoted.
