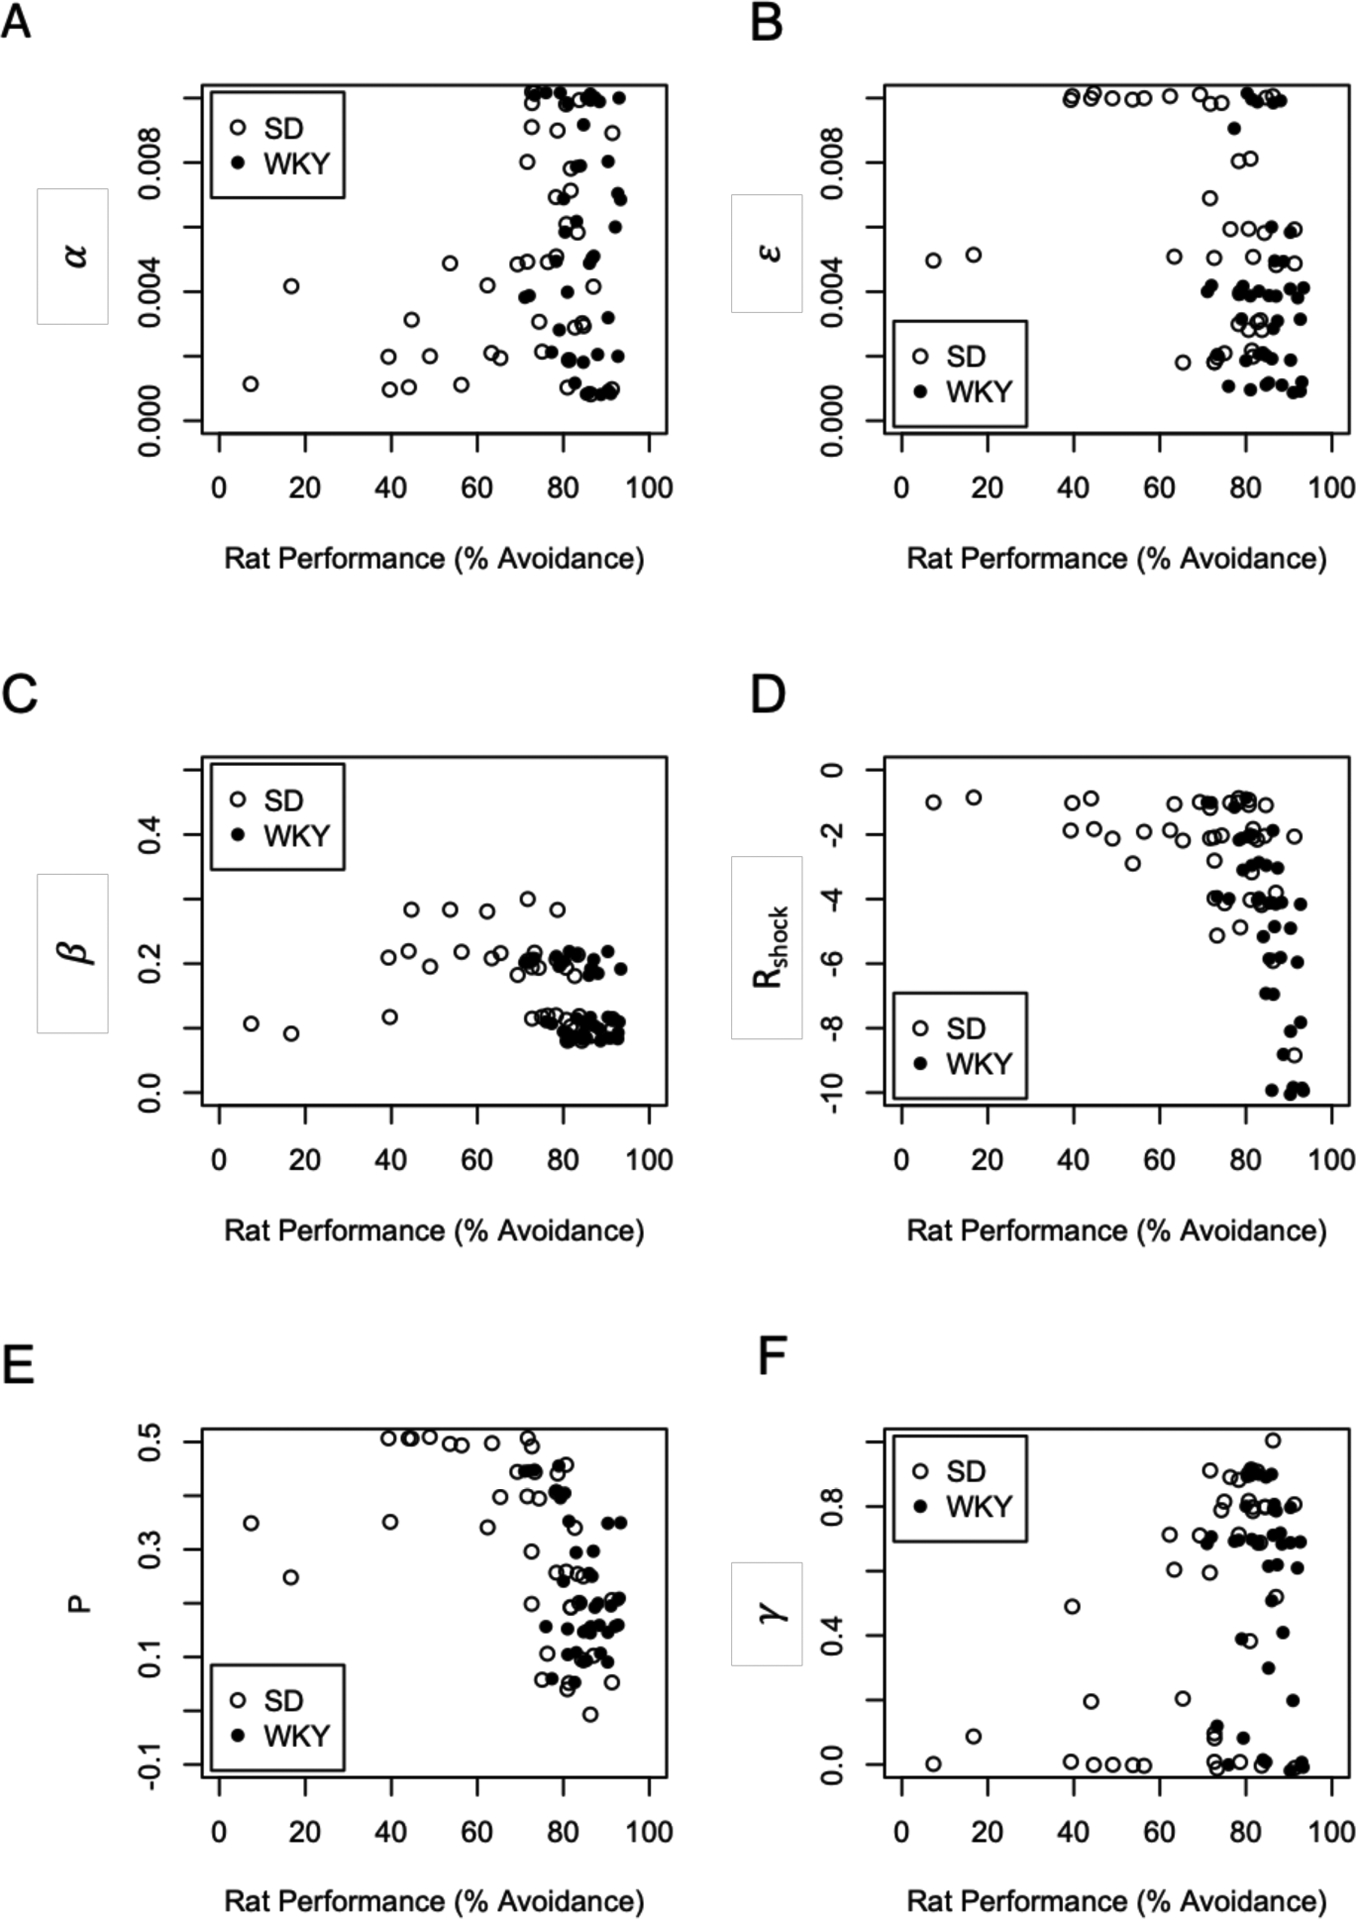
Figure 5.

Relationship between behavior (percent avoidance responses across the acquisition training) and estimated parameter values. Across all 80 animals, rats showing more avoidance tended to have smaller values of ε (learning rate in the actor, p=.004), smaller values of ϐ (less exploration, p<.001), larger (more negative) values of Rshock (subjective value of shock, p<.001), and smaller values of P (less perseveration, p<.001). Results are similar if the two SD animals with poor performance (<25% avoidance) are excluded. These scatterplots include jitter to avoid overlapping points.
