
Figure 6. Calcium staining of NMVCM tissues.
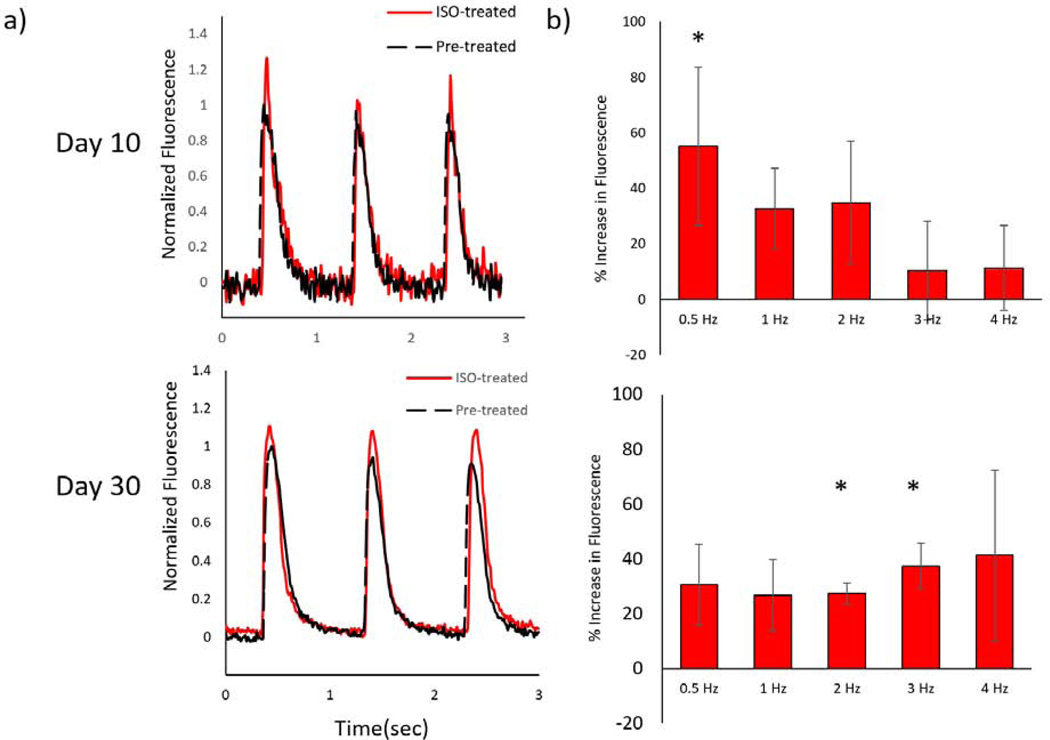
a) Representative normalized fluorescence traces ΔF/Fo traces of day 10 (top) and day 30 (bottom), as well as before (black) and after (red) 100 nM ISO treatment. b) Percent increase in ΔF/Fo (asterisks denote significance ) for day 10 (SEM, n=5 p<0.05) and day 30 sample (SEM, n=3 p<0.05)