
Figure 2. Precise HLB growth control is correlated with histone mRNA biogenesis.
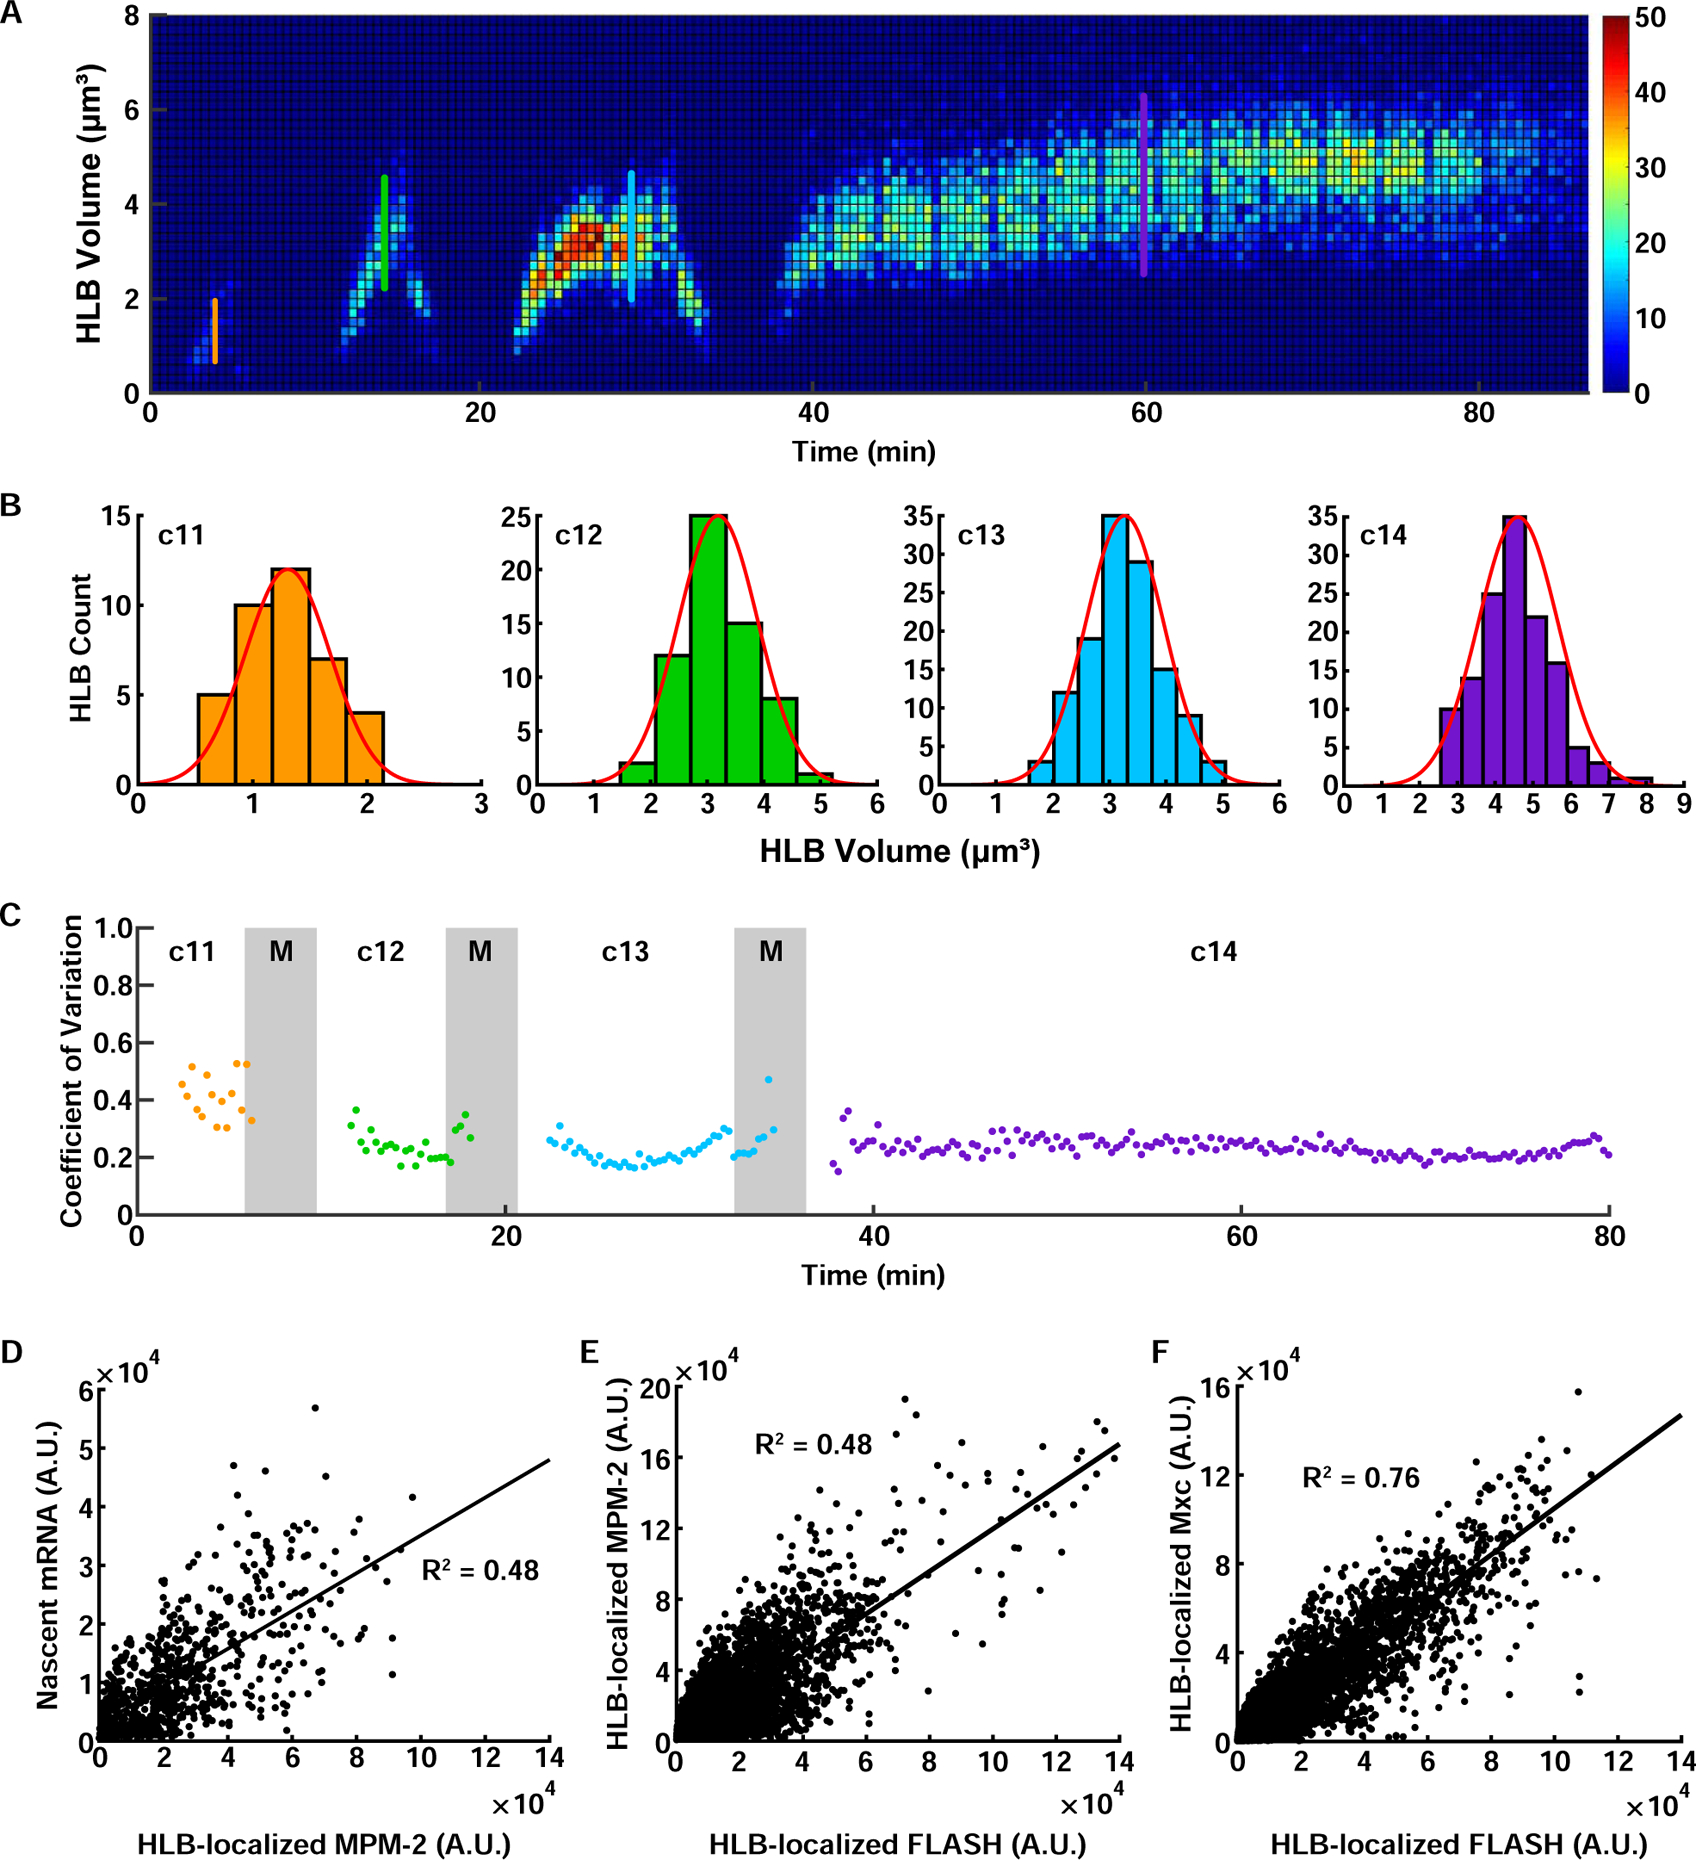
(A) 3D histogram of HLB size distribution from a single embryo. (B) HLB size distribution for each cell cycle during the syncytial blastoderm stage. Each histogram indicates the HLB size distribution at the time points marked with the line with the same color in (A). Red line, fitted normal distribution. (C) Coefficient of variation (CoV) for HLB size over the syncytial blastoderm stage. (D) Correlation of histone H3 nascent mRNA levels and total phosphorylated Mxc in HLBs. N=99 embryos, 4153 HLBs. Correlation of total phosphorylated Mxc (E) (N=76 embryos, 3254 HLBs) and total Mxc (F) (N=93 embryos, 5140 HLBs) with total FLASH in HLBs. A.U., arbitrary units. c, cycle. M, mitosis. Scale bars, 5μm. See also Figure S2.