
Figure 4. Proper HLB formation requires seeding from the histone locus.
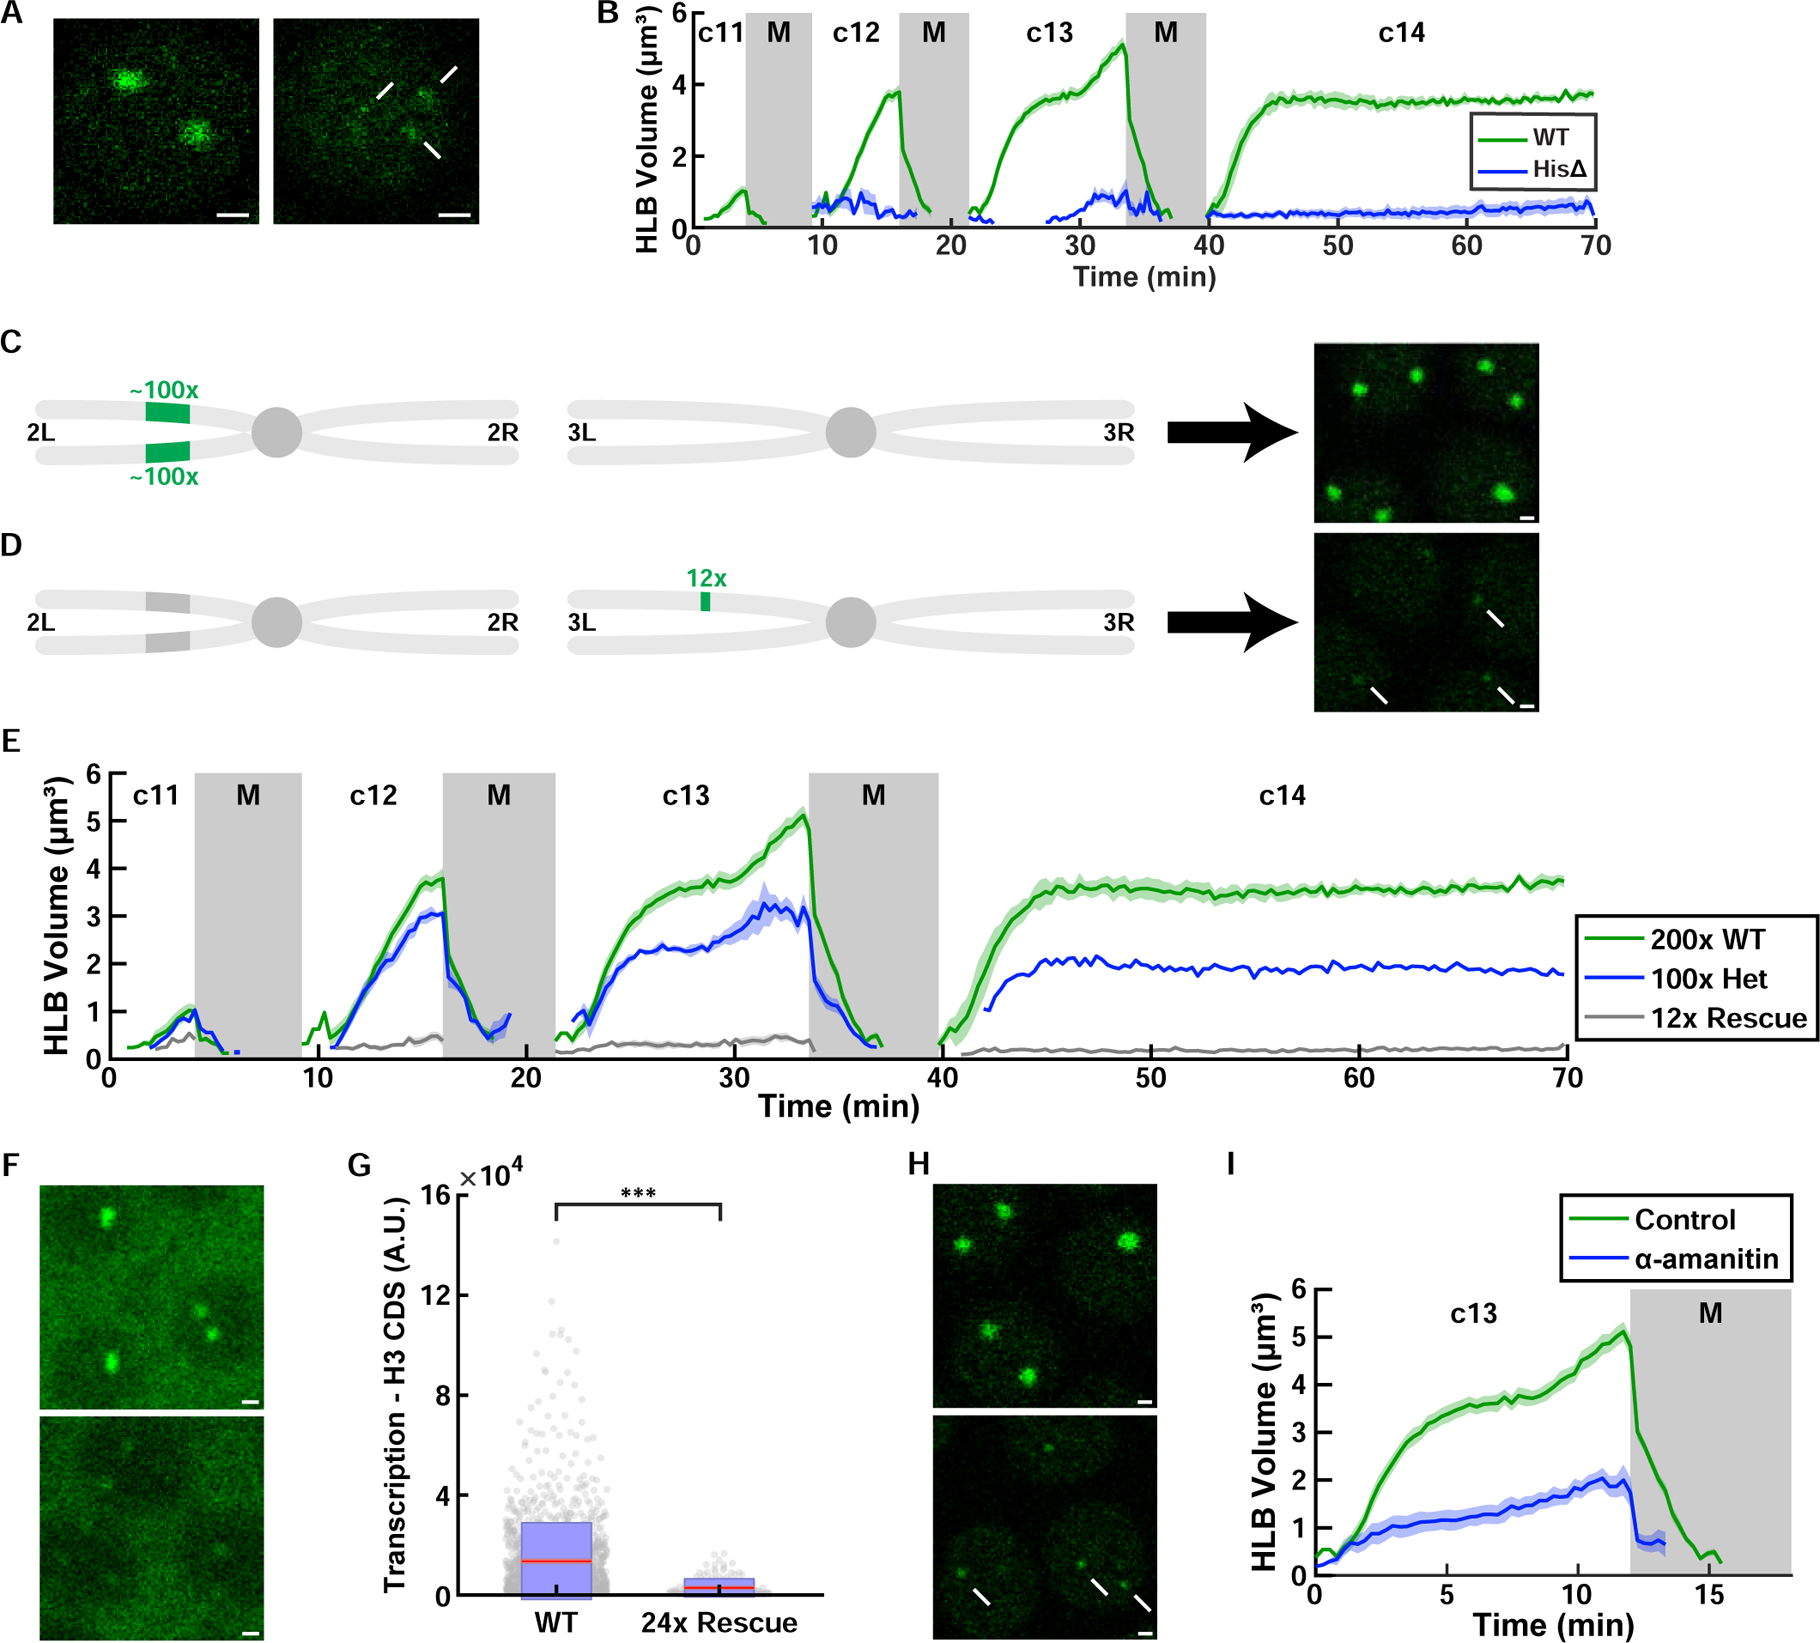
(A) Examples of WT HLB and the transient proto-HLBs observed in homozygous histone deficiency (HisΔ) embryos in cycle 13. Arrows indicate proto-HLBs. (B) Quantification of HLB size for WT and HisΔ (‘histone-null’) embryos. N=10 embryos (WT) and 12 embryos (HisΔ) (C) Schematic of the second and third chromosome for WT flies. Endogenous histone locus is on 2L, and it consists of about 100 copies of tandem repeats of all the canonical histone genes (H3, H4, H2a, H2b, and H1. See Figure 1A). (D) Schematic of the second and third chromosome for 12x histone rescue transgenic flies. 12 copies of histone repeats were inserted into chromosome 3L. Images on the right in (C) and (D) are confocal images of HLBs from each respective genotype in cycle 13. Arrows indicate HLBs. Images were acquired under identical imaging conditions. (E) HLB size for various numbers of histone repeats (200x, 100x, and 12x). N=10 (200x), 9 (100x), 4 (12x) embryos. (F) Histone H3 nascent mRNA visualized by FISH in wild-type (200 copies) and embryos with 24 copies of histone repeats. (G) Quantification of total nascent H3 mRNA in wild-type (N=39 embryos, 1569 HLBs) and embryos with 24 copies of histone repeats (N=7 embryos, 151 HLBs) at cycle 13. p<10−4 (two sample t test). Red, 95% confidence interval for the mean. Blue, 1 standard deviation. (H) HLBs in control and α-amanitin injected embryos. Arrows indicate HLBs. (I) HLB size for DMSO control and α-amanitin injected embryos. N=5 embryos each. Shaded area, SEM. A.U., arbitrary units. c, cycle. M, mitosis. Scale bars, 1μm. See also Figure S4 and Video S3.