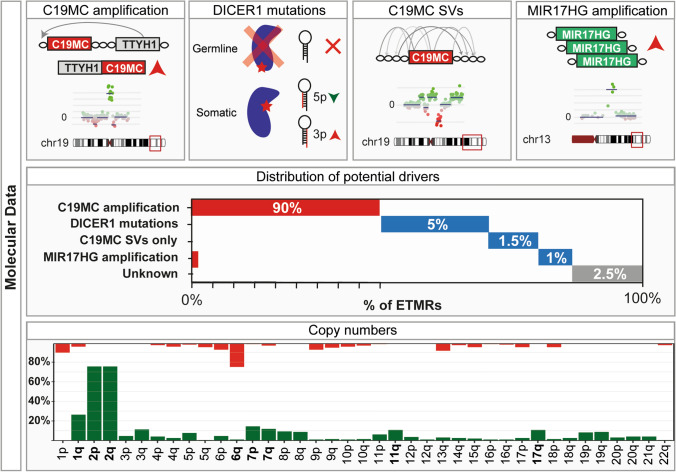
Fig. 4.
Aberrations found in ETMRs. Figure showing the four identified potential drivers of ETMRs schematically in the top row, the distribution of these aberrations in the second row and the distribution of gains and losses in the last row. In the distribution of potential drivers colors denote C19MC + (red) and C19MC − (blue). In the distribution of copy number aberrations green denotes a gain and red denotes a loss. No significant differences in copy number changes have been observed between C19MC + and C19MC − [80]

