Fig. 10.
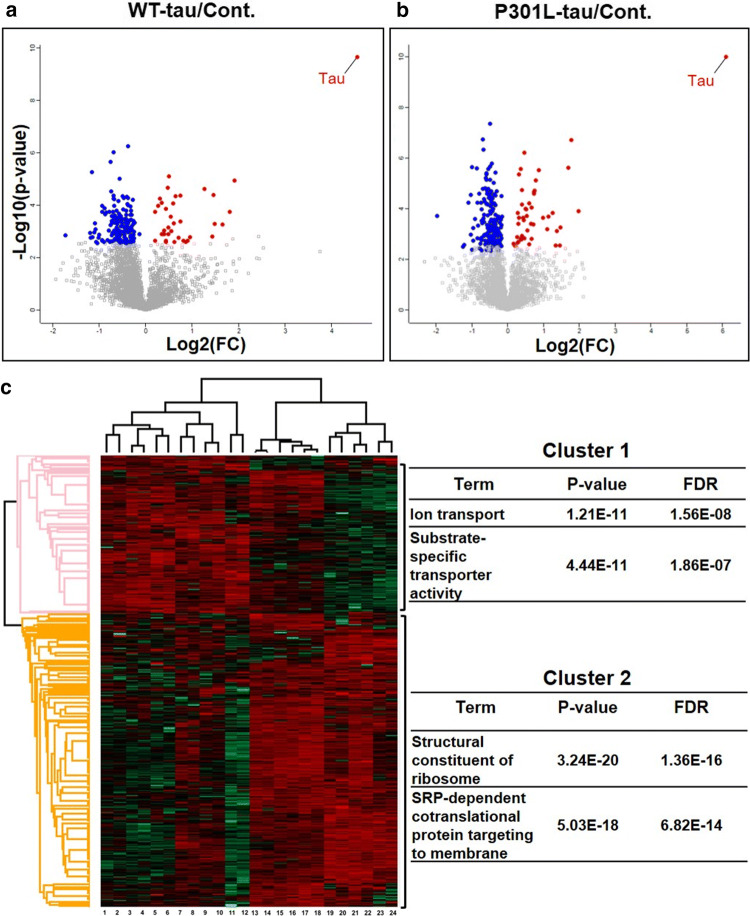
Human tau-expression induced proteomic alterations: a, b Volcano plots of pairwise comparisons (t-tests with BH correction), showing the -log10-p-values (y-axis) and the log2(FC) of the proteins that were differentially expressed (x-axis) in both WT-tau and P301L-tau expressing cells in comparison to controls. The data points depicted in red are showing upregulated proteins and blue is representing downregulated proteins. c The heatmap of hierarchical clustering analysis of 314 DEPs among technical and biological replicates generated by Perseus software. The Log2-transformed expression values of significantly DEPs were normalized by Z-score. The columns are representing samples (tau-expressing cells: lanes 1–12 & control: lanes 13–24) and rows indicating significantly modulated proteins (cluster1, up-regulated (red), cluster2, down-regulated (green). The enriched functional terms (Fisher’s exact test with FDR multiple test correction) with their p-values and FDR values are shown on the right side

