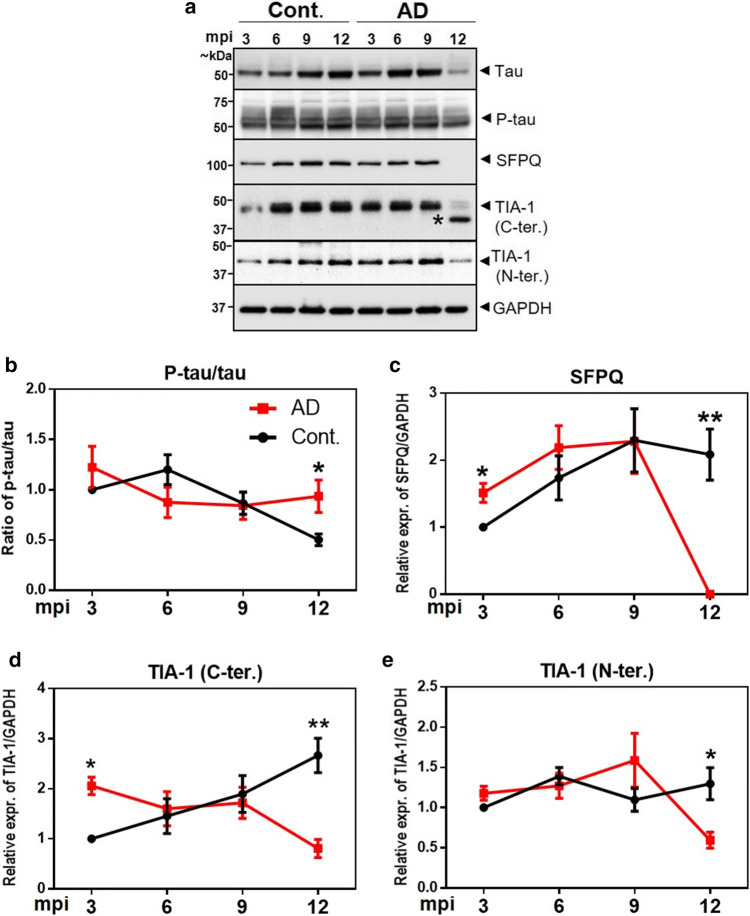
Fig. 11.
Temporal expression profile of total tau (tau-5), p-tau (S199), SFPQ and TIA-1 in 3xTg mice. a Representative immunoblot images showing expression of tau, p-tau, SFPQ and TIA-1 (C- & N-terminal specific antibodies) from AD (3xTg-inoculated, n = 4) mouse brain cortical tissues at the indicated ages (mpi: months post inoculation) and respective controls (3xTg-non-inoculated, n = 4). (*) We are unsure of this band. b–e The densitometric analyses were performed with Image Lab software. Unpaired t-tests were performed to calculate statistical significance at each time point. *p < 0.05, **p < 0.01

