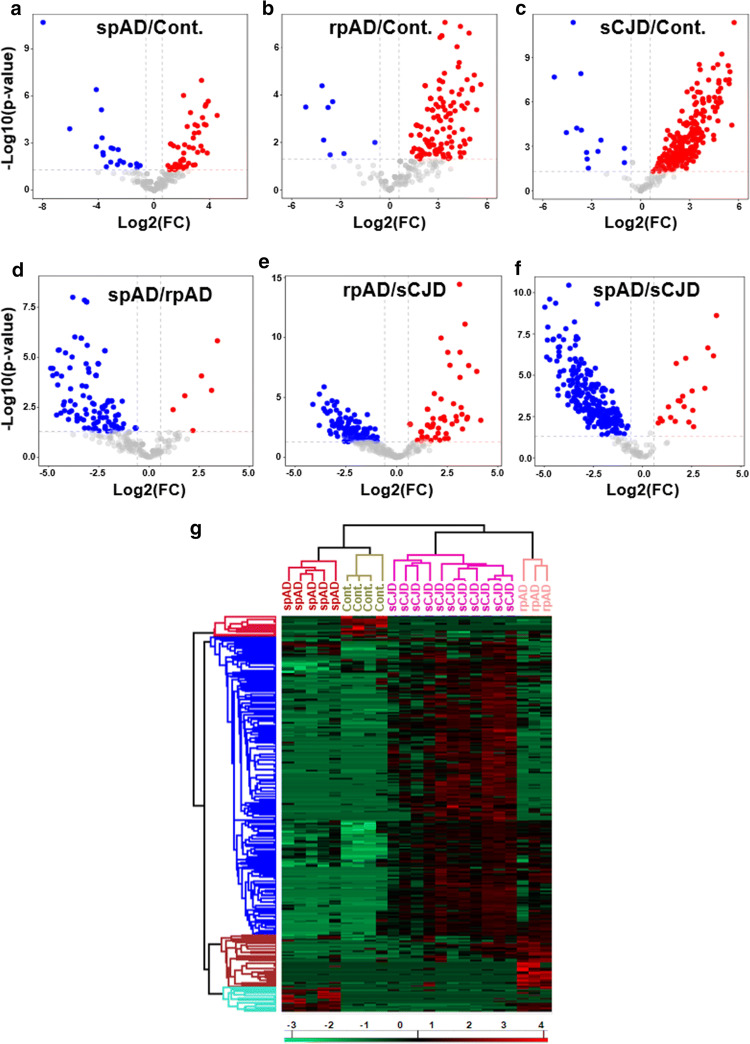
Fig. 2.
Global enrichment profile of RBPome candidates isolated from the human brain frontal cortical region of 20 cases (spAD, rpAD, sCJD-MM1, sCJD-VV2 as well as controls). a–f Volcano plots of pairwise comparisons (t-tests with BH correction) showing, the -log10-p-values (y-axis) and the log2(FC) of the proteins that were significantly abundant (x-axis) in all the group combinations (spAD vs control, rpAD vs control, sCJD vs control, spAD vs rpAD, rpAD vs sCJD, and spAD vs sCJD). The data points above the dashed lines represent proteins having a p-value < 0.05 and FC > ± 1.5 as significant hits and are depicted in red (for enriched) and blue (for depleted). g The heatmap (hierarchical clustering analysis) showing significantly-enriched proteins. The Log2-transformed expression values of proteins were normalized by Z-score for each biological replicate. Horizontal-axis indicates the differentially-enriched proteins, and the vertical axis shows the biological replicates from all the groups. Blue denotes depleted proteins, red represents enriched proteins

