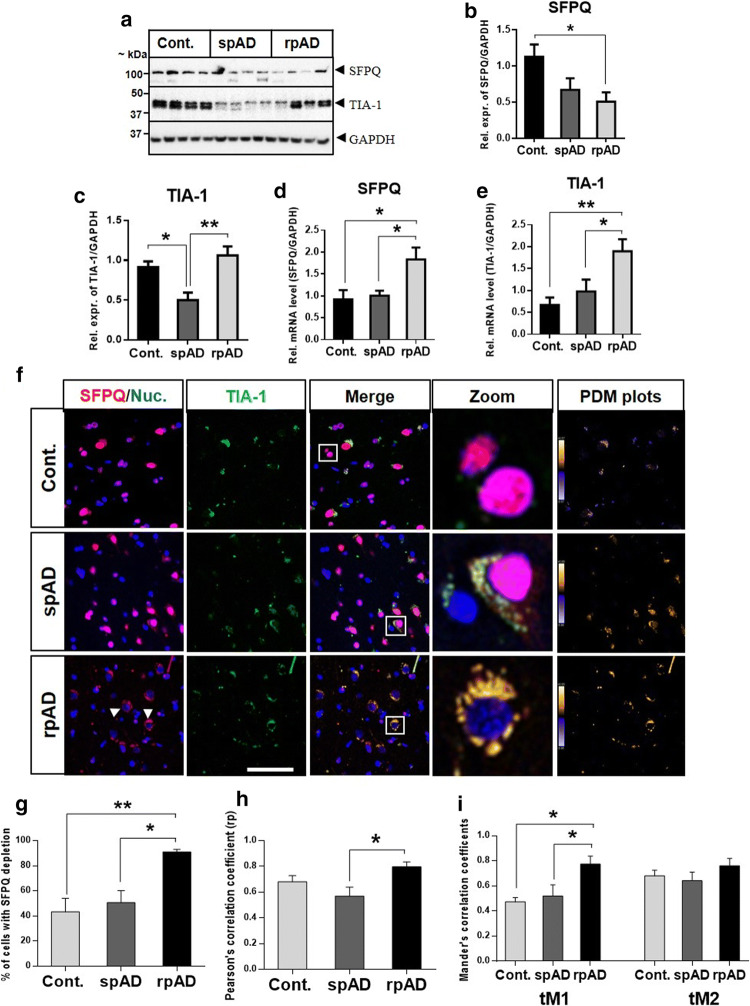
Fig. 5.
Differential expression analysis of SFPQ and TIA-1 at protein and mRNA level. a Representative immunoblot images. Immunoblotting analysis was performed with frontal cortical human brain tissues from spAD (n = 8), rpAD (n = 6), sCJD (-MM1 & -VV2 subtypes, n = 8) and non-demented controls (n = 8). b, c The densitometric analysis of SFPQ and TIA-1. d, e Expression of SFPQ and TIA-1 at mRNA level was analysed in spAD, rpAD, and controls with qRT-PCR (n = 5–8). GAPDH was used to normalize the expression levels of mRNA. The comparative Ct method (2^−ΔΔCt) was used for calculation of relative mRNA levels [45]. f Dislocation of SFPQ from the nucleus and colocalization with SG-marker-TIA-1. Co-immunofluorescence of SFPQ (red) and TIA-1 (green) in the human brain of spAD (n = 4), rpAD (n = 4), and controls (n = 5). Cell nuclei were visualized with To-Pro-3 iodide staining (blue). Representative images are shown (scale bar = 50 um). Intensity correlation analysis (PDM plots) was performed with ImageJ (WCIF Plugin). g Quantification of the cells showing SFPQ dislocation/depletion (n = 150/group). h Pearson’s correlation coefficient (rP) graph, showing significant colocalization between SFPQ and TIA-1 in rpAD cases in comparison to spAD cases. i Colocalization analysis with Threshold Mander’s correlation coefficients (tM1 & tM2). The value of tM1 represents the overlap of TIA-1 channel pixels with SFPQ channel pixels, and tM2 represents the overlap of SFPQ channel pixels with TIA-1 channel pixels. The colocalization analysis was performed with FIJI software (Coloc 2). One-way ANOVA and Tukey post-hoc test for multiple comparisons was used to calculate significance, *p < 0.05, **p < 0.01

