Fig. 6.
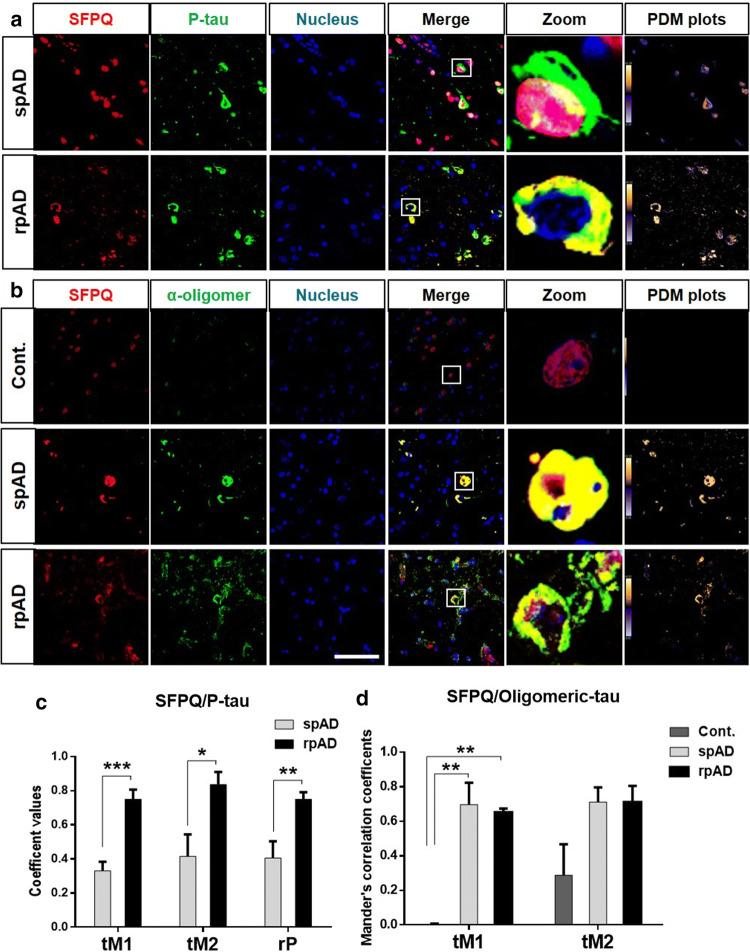
SFPQ colocalize with p-tau tangles and oligomeric-tau in rpAD brains. a Representative images stained with SFPQ (red) and α- p-tau (S199) (green) antibodies (scale bar = 50 μm) in spAD (n = 3) and rpAD (n = 3). Sections were counter stained with To-Pro-3 iodide to visualize nuclei (blue). PDM plots were prepared by intensity correlation analysis (ICA) using Image-J (WCIF plug-in). b Co-immunofluorescence images from control (n = 3), spAD (n = 5) and rpAD (n = 3) cortical sections, stained with α-SFPQ (red) and α-Tau oligomeric antibody: T-22 (green). PDM plots showing colocalization. c Pearson’s correlation coefficient (rP) and threshold Mander’s correlation coefficients (tM1& tM2) representing significant colocalization between SFPQ and p-tau in the rpAD group, in comparison to spAD group. Statistical significance was calculated by t-test, *p < 0.05, **p < 0.01, ***p < 0.001. d Threshold Mander’s correlation coefficient’s (tM1, tM2) showing significant colocalization between SFPQ and oligomeric-tau in both spAD and rpAD, as compared with control. Graphs were prepared with GraphPad Prism (6.01) using One-way ANOVA and Tukey post-hoc test for multiple comparisons, **p < 0.01

