Fig. 8.
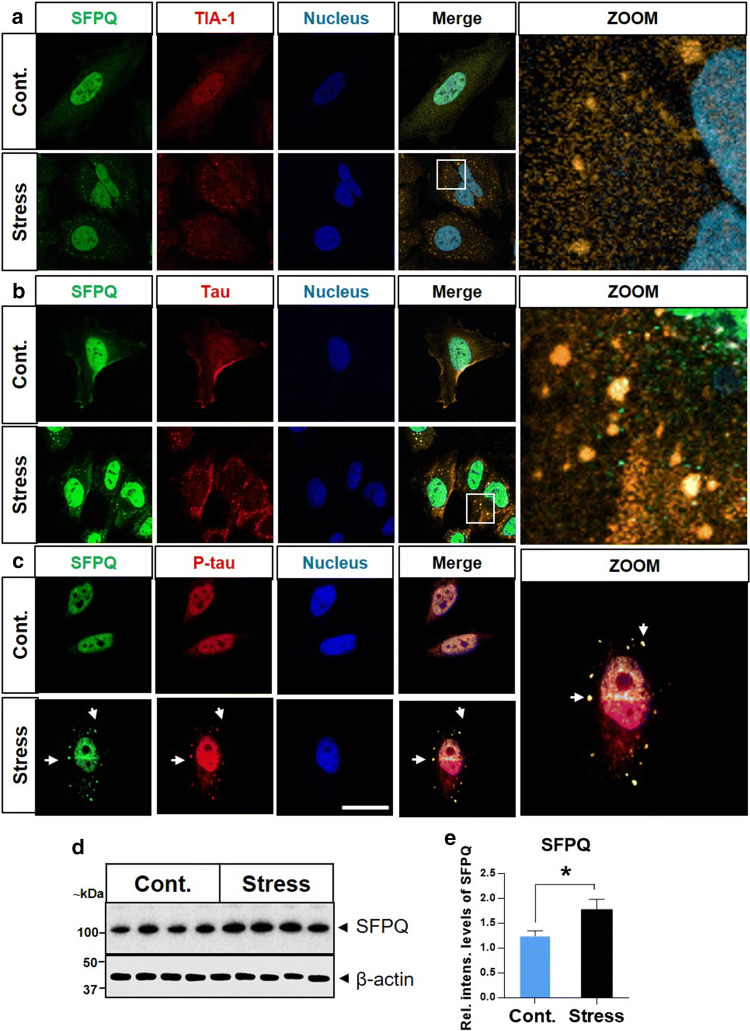
Recruitment of SFPQ into SGs after oxidative stress induction in HeLa cells. a Localization of SFPQ (green) and TIA-1 (red) was investigated using co-immunofluorescence, in sodium arsenite-treated (0.6 mM; 60 min) (stress) and untreated (control) cells. Cells were counter-stained to visualize nuclei (blue), scale bar = 10 μm. b, c SFPQ colocalizes with tau/p-tau in SGs after sodium arsenite induced oxidative stress in HeLa cells. Zoomed-in images of stress (arsenite treated) cells showing the overlap between SFPQ/tau in the cytoplasmic granules. d Representative immunoblot image for SFPQ after stress treatment. Intensity levels were normalized with β-actin. e The densitometric analysis was performed with Image Lab software. Statistical tests (t-tests) were applied in the GraphPad prism (6.01), *p < 0.05

