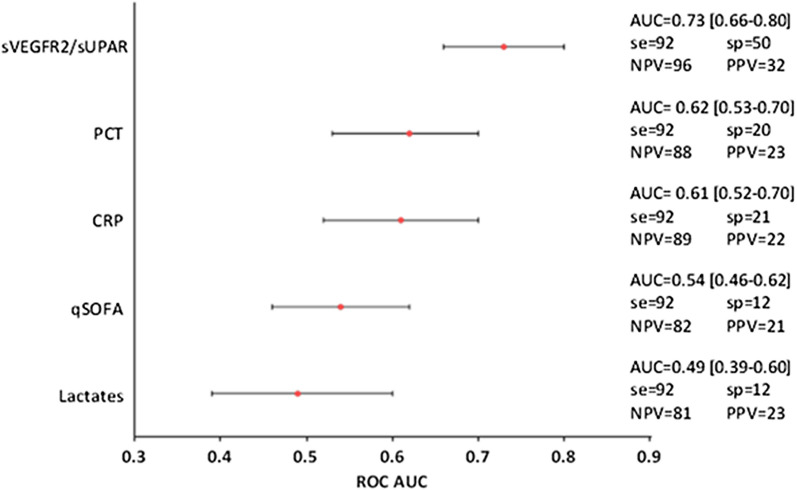
Fig. 3.
Comparison of predictive performance of biomarkers measured at inclusion (T0) on non-severe-infected patients. Sensitivity, specificity and predictive values of biomarkers according to optimized cut-offs to minimal sensitivity of 90%. Abbreviations: AUC [IC] area under the curve and confidence interval (two-sided p value < 0.05), se sensitivity (%), sp specificity (%), NPV negative predictive value (%), PPV positive predictive value (%)

