FIGURE 3.
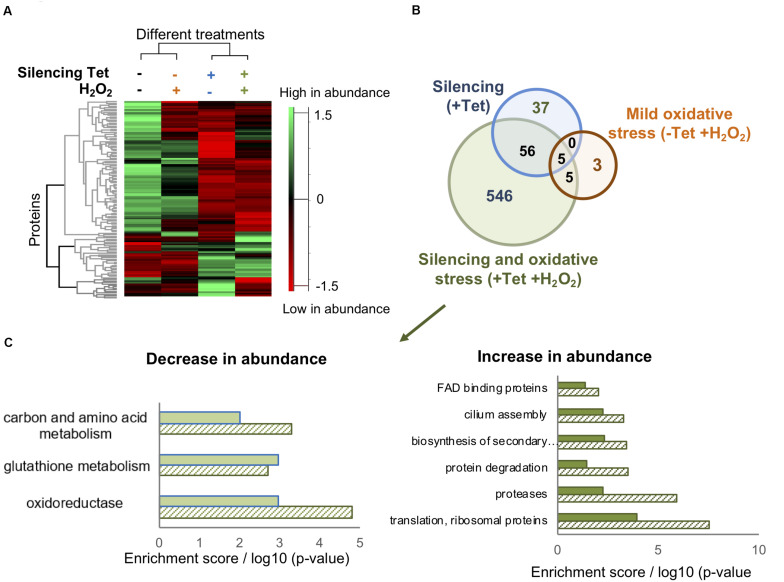
TrypOx silencing alters the T. brucei proteome. (A) Hierarchical clustering of the median expression values of all differentially expressed proteins (FDR < 0.05) identified in the four differently treated TrypOx RNAi cells (B) Venn diagram of the proteins with significantly different abundance (FDR < 0.05) relative to protein abundances in the non-treated cells (C) Functional enrichment analysis (filled bars) of the 546 differentially expressed proteins in induced RNAi TrypOx cells treated with 50 μM peroxide and the Benjamini p-Value for each group, representing the significance (slashed bars).

