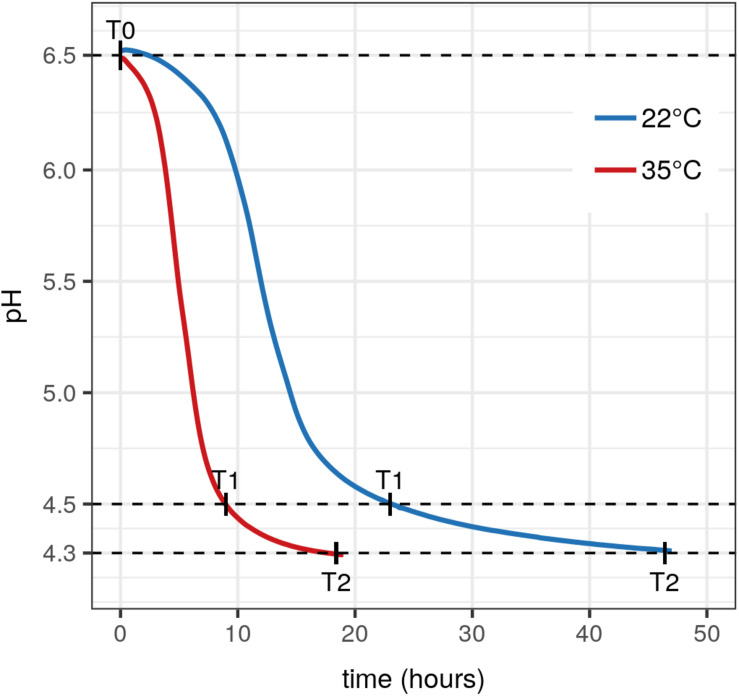
FIGURE 3.
Acidification kinetics of MM100 starter during milk fermentation. Acidification curves of MM100 during milk fermentation at 22°C (blue curve) and 35°C (red curve). Each curve is the average of two pH kinetics from two independent cultures. T0, start of the fermentation after inoculation, T1 and T2, times when pH reached 4.5 and then 4.3.

