FIGURE 1.
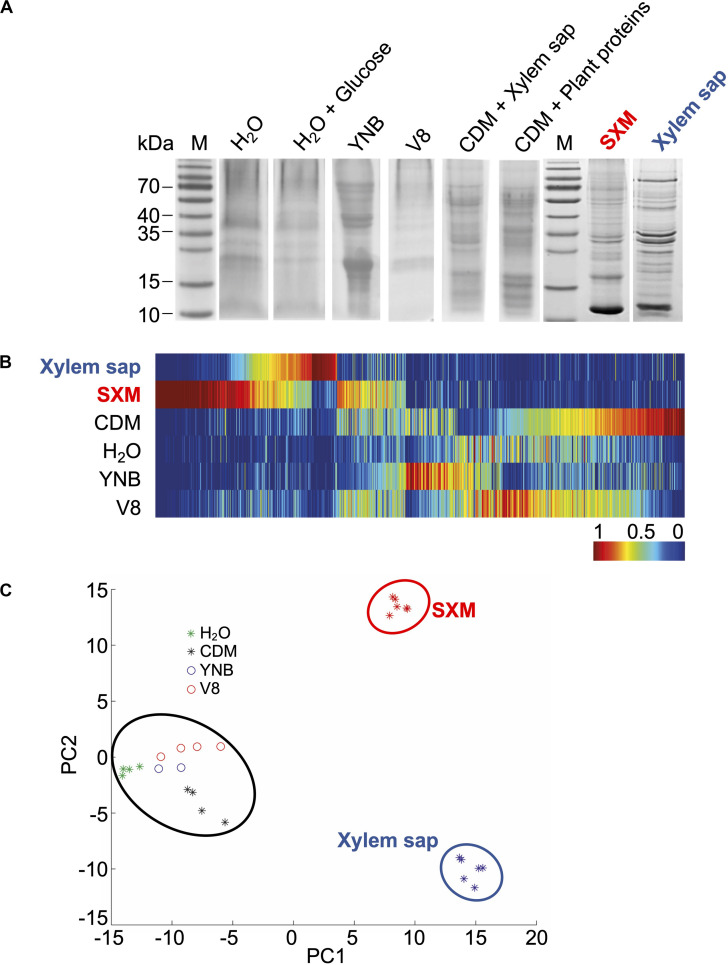
Exoproteome signatures of V. longisporum in different growth media. V. longisporum 43 was cultivated in complete medium (PDM) for 4 days before the sedimented mycelia and spores were dissolved in different media (dH2O, dH2O + 0.1% glucose, yeast nitrogen base (YNB), 10% vegetable juice (V8), minimal medium (CDM) supplemented with 7% xylem sap or plant proteins, simulated xylem medium (SXM) and extracted xylem sap from B. napus) and cultivated for four more days. (A) Precipitated proteins from the supernatants were separated by one-dimensional SDS–PAGE. The colloidal Coomassie stained exoproteome samples on gel displayed a strong variation between the protein band distributions of all different culture conditions. Lanes M represent the molecular weight marker. Complete lanes of the V. longisporum exoproteomes were subjected to tryptical protein digestion and the resulting peptides were analyzed by LC-MS/MS. (B) Clustering analysis of protein abundances (spectral counts) was facilitated by MarVis-Suite tools and is visualized as one-dimensional self-organizing maps. Rows represent the compared growth conditions. The spectral counts were normalized and color-coded according to the indicated scale. Red indicates increased, dark blue no spectral counts. (C) The principle component analysis plot of the exoproteomes based on the spectral counts was performed with MarVis-Suite software (Meinicke et al., 2008). Each dot represents one independent culture. The compared exoproteome signatures cluster in three groups: a first cluster is formed by all xylem sap culture samples (blue circle); the second cluster contains all SXM culture samples (red circle) and the third cluster consists of all other samples (black circle).

