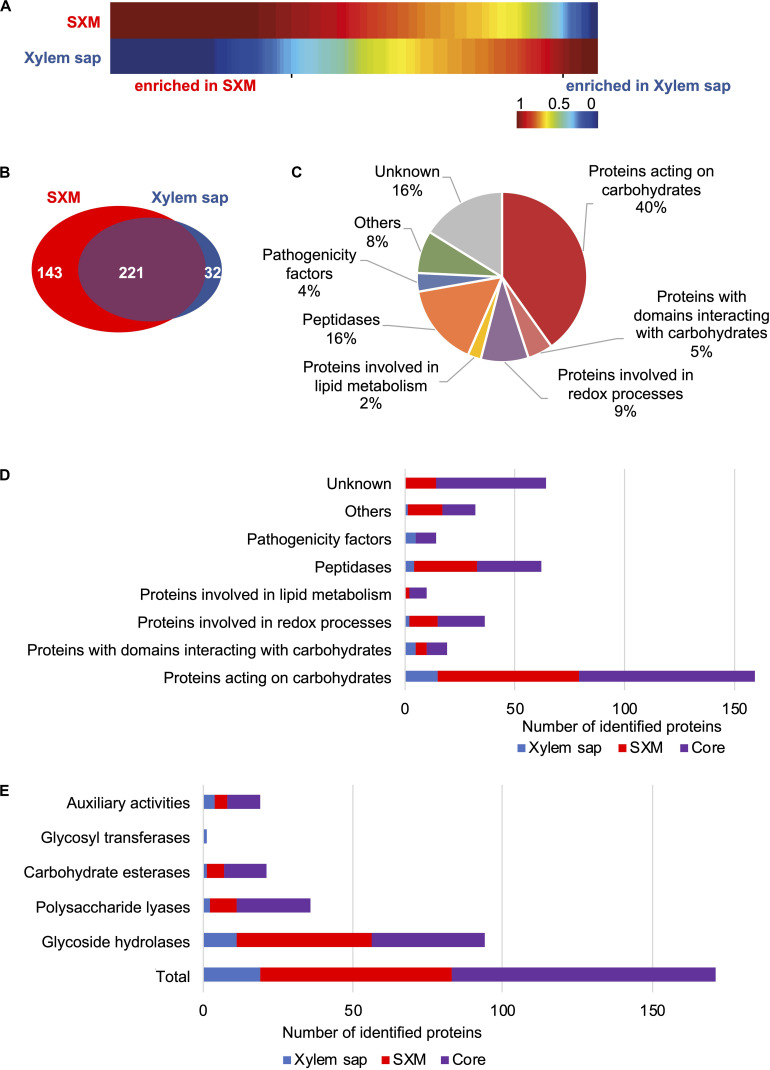
FIGURE 2.
Comparison of exoproteome signatures for V. longisporum growth in xylem sap and pectin-rich simulated xylem medium. The exoproteome of V. longisporum upon cultivation in simulated xylem medium (SXM) and xylem sap was compared. A list of identified proteins is found in Supplementary Table S1. (A) Clustering analysis of protein abundances (spectral counts) is visualized as one-dimensional self-organizing maps, which was facilitated by the software MarVis-Suite. Upper and lower rows represent the two compared growth conditions. Each column corresponds to spectral counts of one identified protein. The spectral counts were normalized and color-coded according to the indicated scale. Red indicates increased, dark blue no spectral counts. (B–E) BLAST searches of identified V. longisporum proteins in panel (A) against the V. dahliae JR2 and the V. alfalfae VaMs.102 proteomes from Ensembl Fungi were conducted and functional analysis is based on their protein sequences. (B) The Venn diagram displays the number of proteins specifically enriched in xylem sap (blue) and proteins enriched in SXM (red). Similarly enriched proteins in both media form the core exoproteome (violet). (C) The cake diagram shows the functional classification of the 396 identified secreted proteins into main protein groups according to their predicted domains. (D) The functional groups are presented with the number of identified proteins in the different cultivation environments. (E) Classification by CAZyme modules is shown for each cultivation type.

