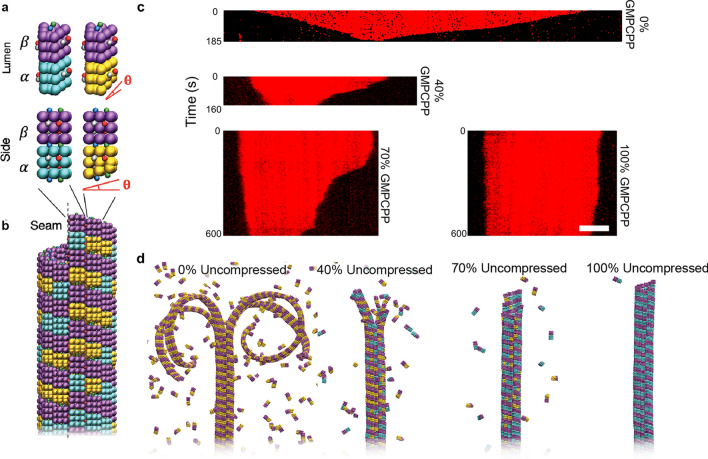
Figure 1.
Model and experimental systems for examining microtubule depolymerization dynamics. (a) Coarse-grained models of tubulin dimers, which comprise wedge-shaped α- (blue, gold) and β-subunits (purple) that are either identical in shape (uncompressed dimers, left) or with α-subunits that are vertically compressed by angle θ (compressed dimers, right). Model wedges include lateral and vertical attractive sites that have color-specific interactions, where lateral sites are vertically offset across the wedges to stabilize the pitch-3 microtubule lattice. (b) Top portion (plus-end) of a full model microtubule containing 40% uncompressed dimers prior to depolymerization. Wedges are shaped such that thirteen vertical protofilaments fit in the lattice, representing the typical number of protofilaments in a typical microtubule in vivo. (c) Kymographs of TRITC-labeled microtubules with 0%, 40%, 70%, and 100% incorporated GMPCPP. Timescale are included on the left of each kymograph. All microtubules are displayed with the minus-end on the left and plus-end on the right. Scale bar correspond to 2 µm. (d) Full model microtubules composed of 0%, 40%, 70%, and 100% uncompressed dimers undergoing depolymerization.

