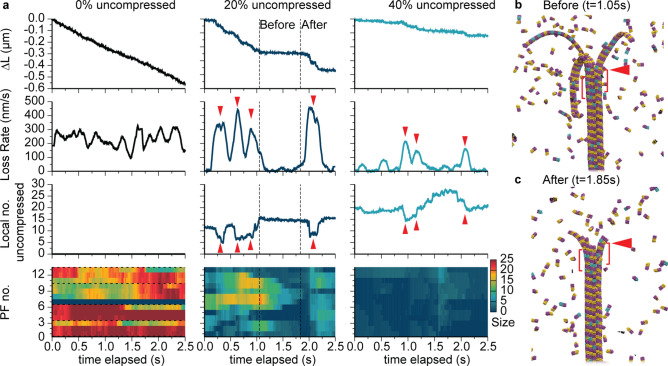
Figure 4.
Instantaneous depolymerization rates and mechanisms as a function of microtubule composition from simulations. (a) Net length of microtubule lost ∆L, depolymerization loss rate, local number of uncompressed dimers, and heat maps indicating sizes of exposed protofilaments as a function of simulation time elapsed. Local numbers of uncompressed dimers are based on the first full three dimer rows after the ram’s horns. Exposed protofilament lengths are measured starting from the last intact row of the microtubule; horizontal dashed lines indicate observed boundaries of ram’s horns. Downward (upward) red triangles highlight instances of large depolymerization rates (low numbers of uncompressed dimers) for 20% and 40% uncompressed. (b,c) Model microtubule configurations before and after an interruption for 20% uncompressed, corresponding to the dashed lines in (a). Red triangles in both panels indicate the intact portion of the microtubule at 1.05 s that defines the three-row region for counting uncompressed dimers shown in brackets.

