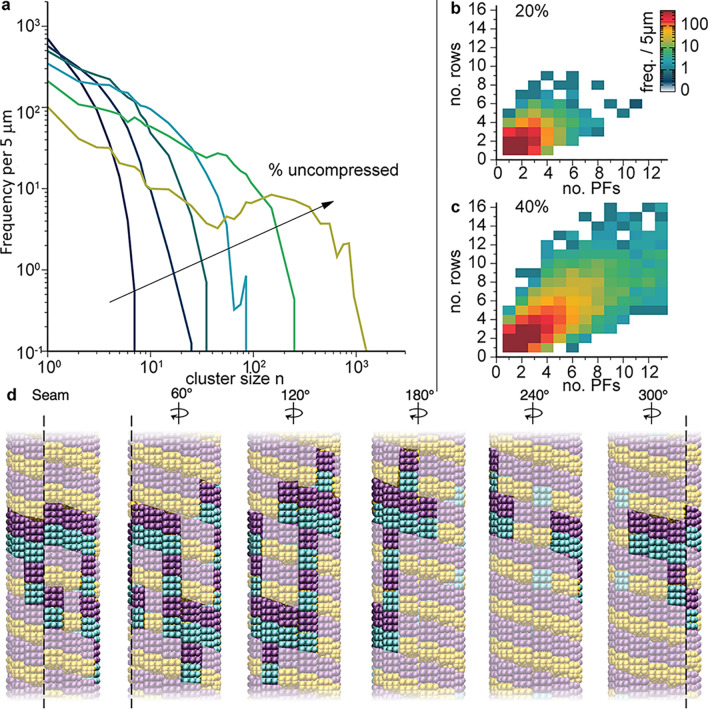
Figure 5.
Clusters of uncompressed dimers as a function of microtubule composition. (a) Histogram h(n) of cluster size distribution per 5 µm weighted by size n to make data at large n visible in plot. Histograms are for 10, 20, 30, 40, 50, and 60% (dark blue to light green) uncompressed microtubules. Uncompressed dimers were considered part of the same cluster if they share at least one vertical or horizontal subunit bond. (b, c) Heat maps of frequency of cluster footprints observed for 20% and 40% uncompressed, respectively, where footprints are given in terms of numbers of dimer rows and protofilaments spanned by the cluster. (d) Images at different rotations of the largest cluster observed for 20% uncompressed, comprising 21 dimers and having a footprint spanning 6 dimer rows and 11 protofilaments.

