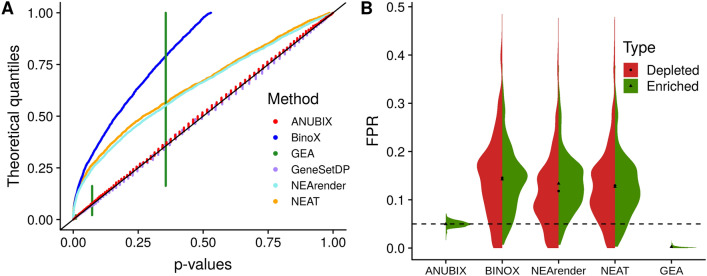
Figure 4.
P-value uniformity test of ANUBIX, Binox, GEA, GeneSetDP, NEArender and NEAT. 10,000 random gene sets of 110 genes were tested for crosstalk enrichment against the KEGG pathway “Prostate cancer” (A). Reported p-values are plotted against theoretical quantile (rank). A perfect method should adhere to the diagonal. (B) Distributions of the FPR for all KEGG and REACTOME pathways tested with ANUBIX, BinoX, NEArender, NEAT and GEA. Green distribution for enriched tests and red distribution for depleted. The dashed line at FPR = 0.05 denotes the expected FPR level. The black triangle and circle represent the mean FPR for enrichment or depletion respectively. Software: R version 3.4.3 https://www.r-project.org/.

