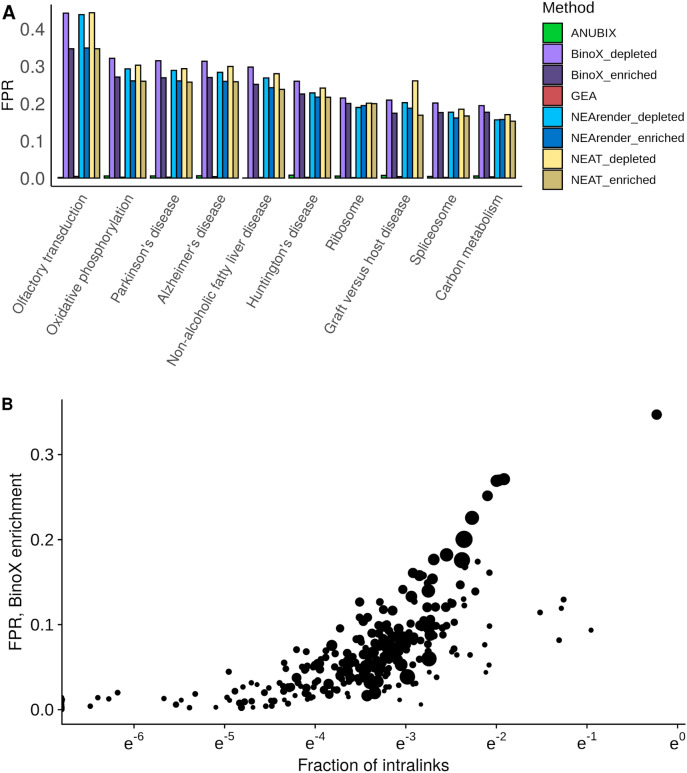
Figure 5.
Analysis of why certain pathways are very prone to produce false positives. 10,000 random gene sets of 110 genes were tested independently for crosstalk enrichment against the KEGG pathways. (A) The top ten pathways that produce the highest false positive rate (FPR) with BinoX, and the FPR obtained with other methods. (B) Fraction of intralinks for each of the KEGG pathways against FPR. The size of the point reflects the total number of links in each pathway. Software: R version 3.4.3 https://www.r-project.org/.

