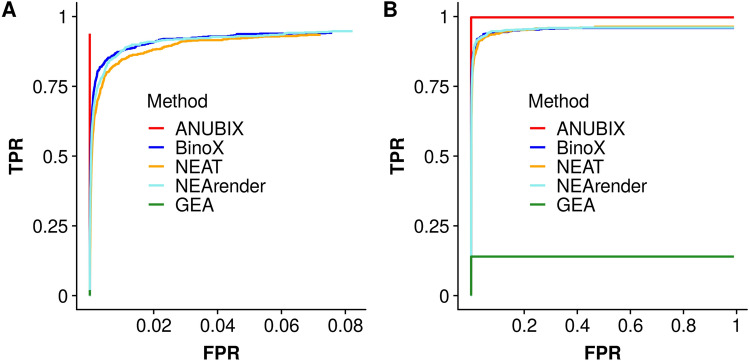
Figure 6.
Receiver Operating Characteristic (ROC) curve. For the TP tests, each KEGG and REACTOME pathway is divided into two and a TP is interpreted as the crosstalk between two parts from the same pathway. For the FP tests, 10,000 random gene sets of size 110 are tested for enrichment against KEGG and REACTOME pathways. (A) ROC curve for only the significantly enriched tests (FDR < 0.05). (B) ROC curve for all enriched tests. Software: R version 3.4.3 https://www.r-project.org/.

