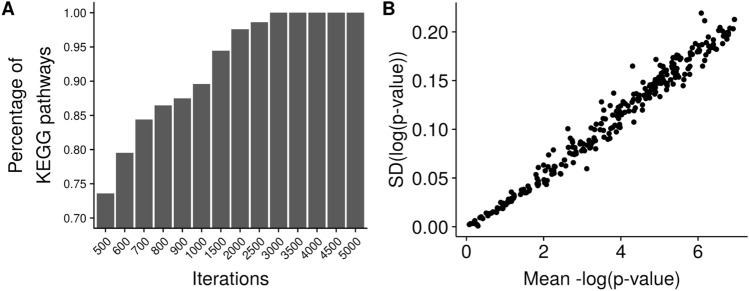
Figure 7.
Stability analysis of ANUBIX. (A) Fraction of KEGG pathways with Coefficient of variation (CV) below 2% for different number of iterations. (B) ANUBIX p-values are stable—their variance is low, and proportional to the magnitude of the p-value. A randomly chosen MSigDB gene set, DAIRKEE_CANCER_PRONE_RESPONSE_BPA, was run 100 times against KEGG pathways. Standard deviation of the log(p-value) is plotted against the mean-log(p-values) for each pathway. Software: R version 3.4.3 https://www.r-project.org/.

