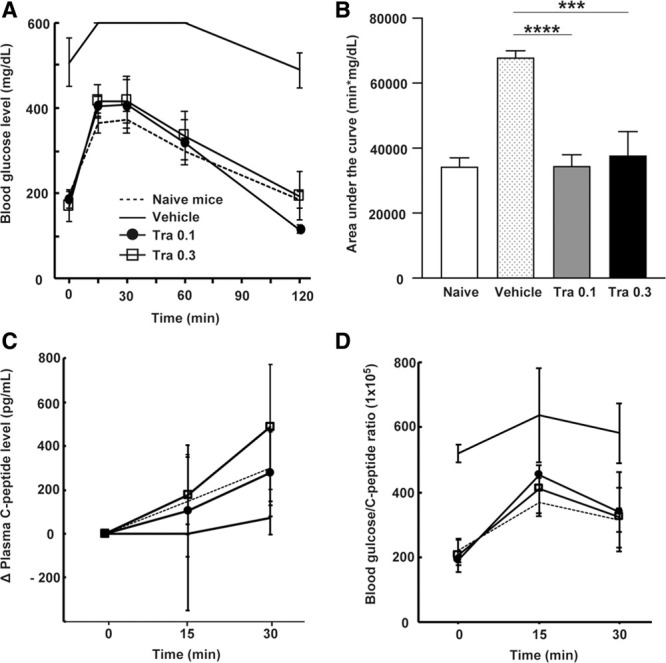
FIGURE 2.

On d 7, an IPGTT was performed for recipient mice treated with vehicle or trametinib (0.1 or 0.3 mg/kg); also, blood glucose levels were measured and compared with those of naive mice (A). The area under the curve (AUC) was calculated (B); 1-way ANOVA followed by the Tukey-Kramer test (***P < 0.001 vs vehicle-treated mice, ****P < 0.0001 vs vehicle-treated mice). ΔPlasma C-peptide levels during IPGTT, expressed as pg/mL (C). Blood glucose/C-peptide ratio (D); 2-way ANOVA followed by the Tukey-Kramer test. Data are expressed as the mean ± SD of 3 independent experiments. IPGTT, intraperitoneal glucose tolerance test; Tra, trametinib.
