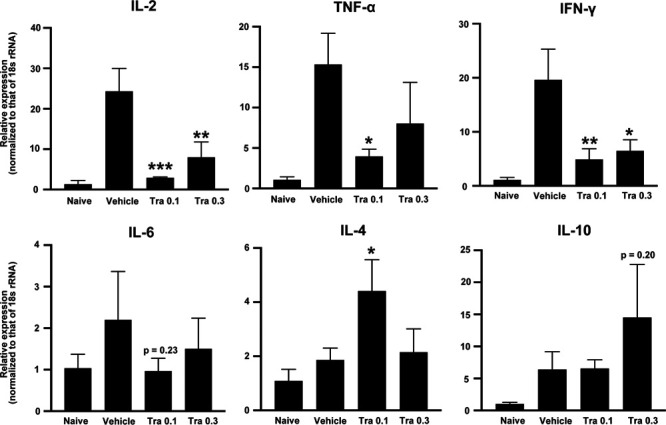
FIGURE 5.

Q-PCR analysis of IL-2, IL-4, IL-6, IL-10, TNF-α, and IFN-γ mRNA expression in the liver of islet graft recipients treated with vehicle, or with 0.1 or 0.3 mg/kg trametinib (Tra 0.1 and Tra 0.3, respectively). Expression of each gene was normalized to that of 18s rRNA, and then quantified relative to that in naive mice. Data shown are from 3 independent experiments and are expressed as the mean ± SD (n = 3/group; *P < 0.05, **P < 0.01, ***P < 0.001, compared with the vehicle groups, 1-way ANOVA followed by the Tukey-Kramer test). IFN, interferon; IL, interleukin; Q-PCR, quantitative real-time PCR; TNF, tumor necrosis factor.
