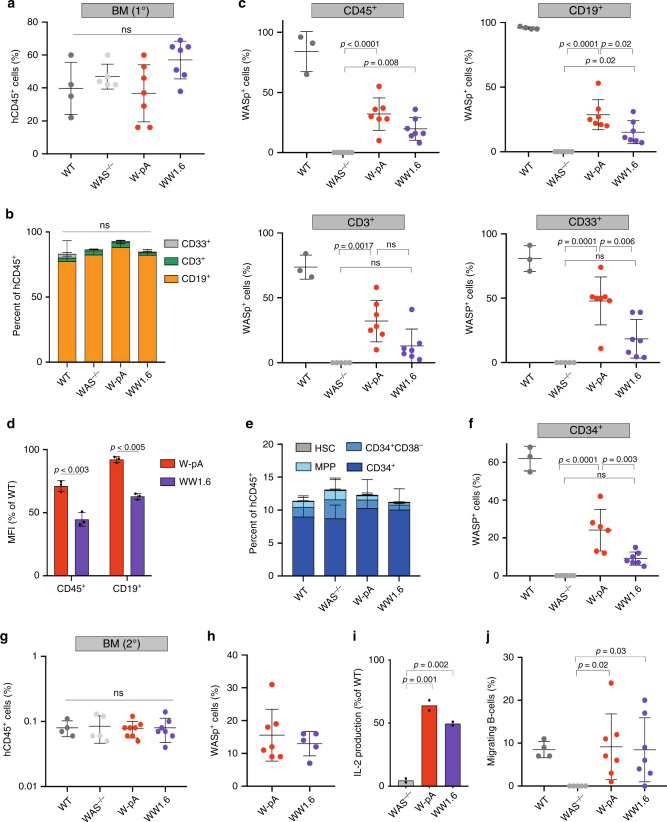
Fig. 5. In vivo hematopoietic reconstitution by gene targeted WAS HSPCs.
a Engraftment and b lineage distribution of human cells (hCD45+) in the BM of NSG mice 14 weeks after primary transplant (n = 7 mice for all groups except for WT (n = 4) and WAS−/− (n = 5); NS: p > 0.05). c Percentage of WASp-expressing cells in the BM for each lineage (n = 7 mice for all groups except for WT (n = 3) and WAS−/− (n = 5); exact p-values are shown in the panel). d WASp expression (expressed as MFI, mean fluorescence of intensity) mediated by each of the therapeutic vector in hCD45+ and CD19+ cells, relative to that detected in wild-type (WT) cells (n = 7 mice for all groups; exact p-values are shown in the panel). e Stem cell and progenitor distribution within BM hCD45+ human cells (n = 7 mice for all groups except for WT (n = 4) and WAS−/− (n = 5); for HSC, MPP and CD34+ CD38- populations: p = 0.018 WAS−/− versus WW1.6, p = 0.008 W-pA versus WW1.6. f Percentage of CD34+ cells expressing WASp in the BM (n = 7 mice for WW1.6, n = 6 for W-pA, n = 5 for WAS−/− and n = 3 for WT; exact p-values are shown in the panel). g Engraftment of human cells (hCD45+) in the BM of NSG mice 12 weeks after secondary transplant (n = 7 mice for WW1.6, n = 8 for W-pA, n = 6 for WAS−/− and n = 4 for WT; NS: p > 0.05). h Percentage of BM hCD45+ cells expressing WASp in secondary transplanted animals (n = 5 mice for WW1.6, n = 7 for W-pA; NS not significant). i Quantification of IL-2 production by mock, edited, LV-transduced thymic WAS T-cells (n = 2 independent experiments from pooled thymi derived from 4 to 7 mice per experimental group; exact p-values are shown in the panel). j Percentage of migrating B-cells in response to SDF-1α (n = 7 mice for all groups except for WT (n = 4) and WAS−/− (n = 5); exact p-values are shown in the panel). Data in Fig. 5 are presented as mean ± SD. P-values were calculated using one-way ANOVA with Bonferroni’s comparison test (a, c, f–j), two-way ANOVA with Bonferroni’s comparison test (b, e) or two-tailed unpaired Student’s t test (d). Source data are provided as a Source Data file.

