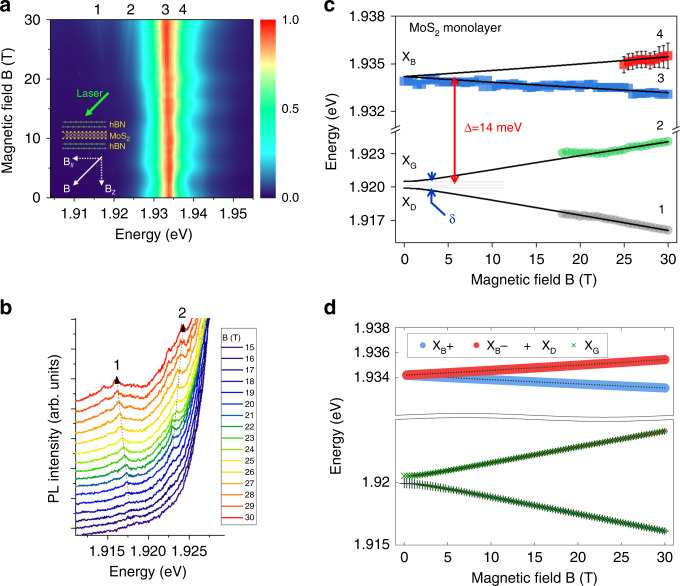
Fig. 4. Tilted (45°) magnetic field—the four mixed excitons states (labeled 1, 2, 3, 4) in MoS2 monolayer revealed by magneto-photoluminescence.
a Color map of the variation of the PL intensity as a function of B; b PL spectra for magnetic fields from 15 to 30 T showing the emergence of the two lowest energy states 1 and 2 (mainly with gray and dark components). c Magnetic field dependence of the energy of the four mixed exciton states. The full lines are fits to the model described in the text. The notations dark exciton (XD), gray exciton (XG) and bright excitons (XB) are only strictly valid at 0 T. d Same fitting results than in c. The size of each symbol is proportional to the weight of each component (the two bright component XB+ and XB− and the two dark component XG and XD) (see Supplementary Note 7 for the calculation of the weight of the four components at high field).

