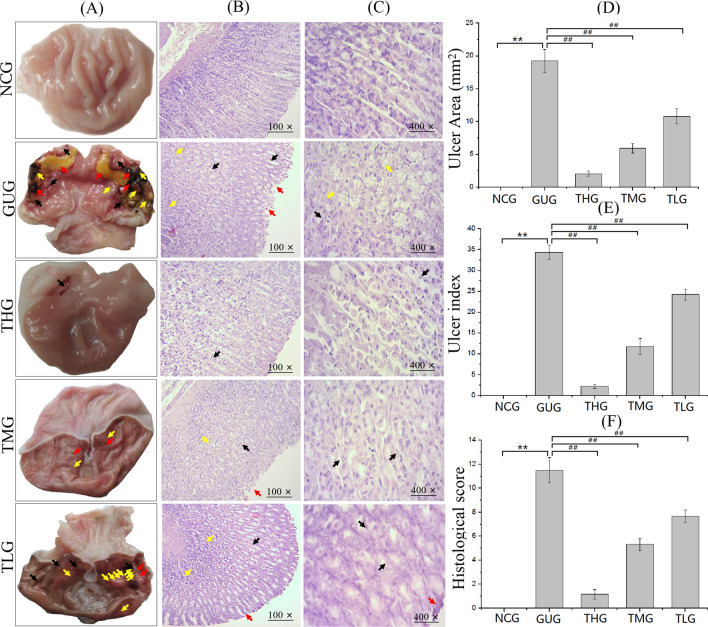
Figure 10.
Macroscopic and microscopic analysis of stomach tissue after troxipide treatment. (A) Macroscopic analysis of GU after troxipide treatment. (B) Sections of the gastric mucosa (H&E staining) (100×). (C) Sections of the gastric mucosa (H&E staining) (400×). (D) Ulcer area. (E) Ulcer index. (F) Histological scores. NCG, normal group (0.9% normal saline 10 mL kg−1 day−1); GUG, gastric ulcer group (5% acetic acid 10 mL kg−1 day−1); THG, high-dose troxipide group (5% acetic acid 10 mL kg−1 day−1 + Troxipide 60 mg kg−1 day−1); TMG, medium-dose troxipide group (5% acetic acid 10 mL kg−1 day−1 + Troxipide 40 mg kg−1 day−1); TLG, low-dose troxipide group (5% acetic acid 10 mL kg−1 day−1 + Troxipide 20 mg kg−1 day−1). Values are presented as means ± SD for all groups (n = 10). *P < 0.05 and **P < 0.01 indicate statistically significant differences when the GUG is compared with the NCG. #P < 0.05 and ##P < 0.01 indicate statistically significant differences when the troxipide treatment groups is compared with the GUG.

