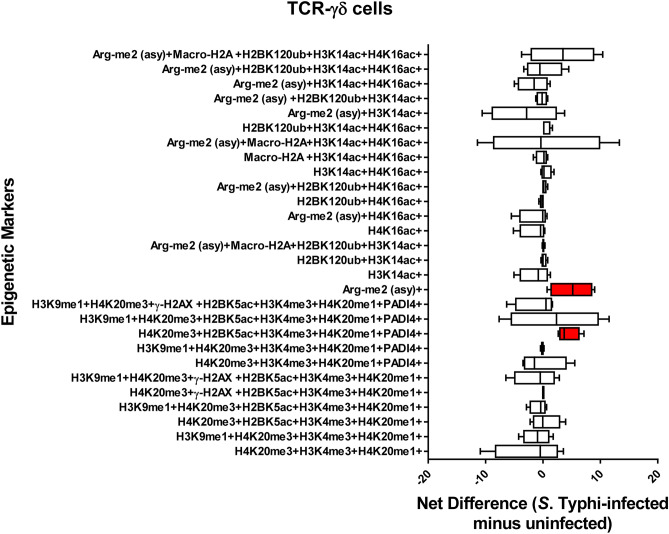
Figure 9.
Chromatin profiles of the epigenetic changes in TCR-γδ cells induced by S. Typhi. Cells isolated cells from healthy terminal ileum surgical tissues were exposed to S. Typhi strain Ty2 (Ty2) and cultured as described in Fig. 1. Cells cultured with media only were used as controls (media). FCOM data of the 28 combinations within the acceptability criteria for changes of the chromatin marks are shown. Bars represent the net difference (S. Typhi-infected minus uninfected cultures). Bar graphs extend from the 25th to 75th percentiles; the line in the middle represents the median of the pooled data. The whiskers delineate the smallest to the largest value. Data are representative of three experiments with terminal ileum segments from 4 different donors, one replicate each. P values < 0.05 were considered significant (red-colored boxes).

