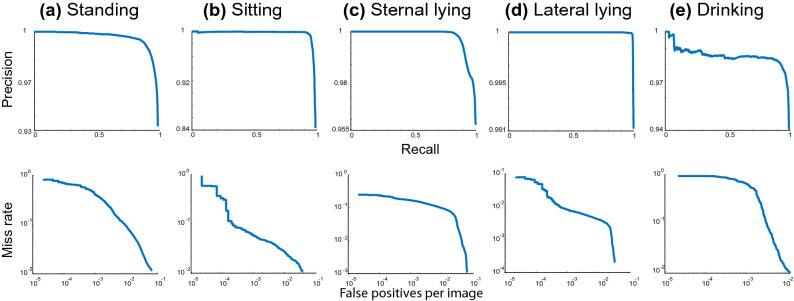
Figure 4.
The performance of our primary model. Upper row: precision-recall curve. A point on the precision-recall curve is determined by considering all pig behaviours detected with a given threshold as positive predictions, then calculating the resulting precision and recall for that threshold. Below row: miss rate against FPPI. This characteristic curve obtained with similar mechanisms of the PR curve however to represent miss detected pigs; both axes are logarithmically scaled.

