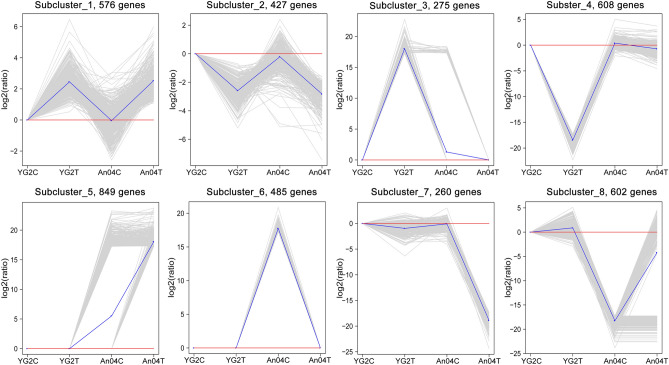
Figure 4.
K-means clustering of gene expression profiles in Yugu2 and An04 during salt stress. The x-axis indicates the samples, and y-axis represents the relative expression level. Gray lines exhibit the relative expression levels of DEGs in different samples before and after treatment, blue line represents the average values of relative expression in each sub-cluster. NbClust package of R (V 1.4 https://cran.r-project.org/web/packages/NbClust/index.html) was used to create this figure.

