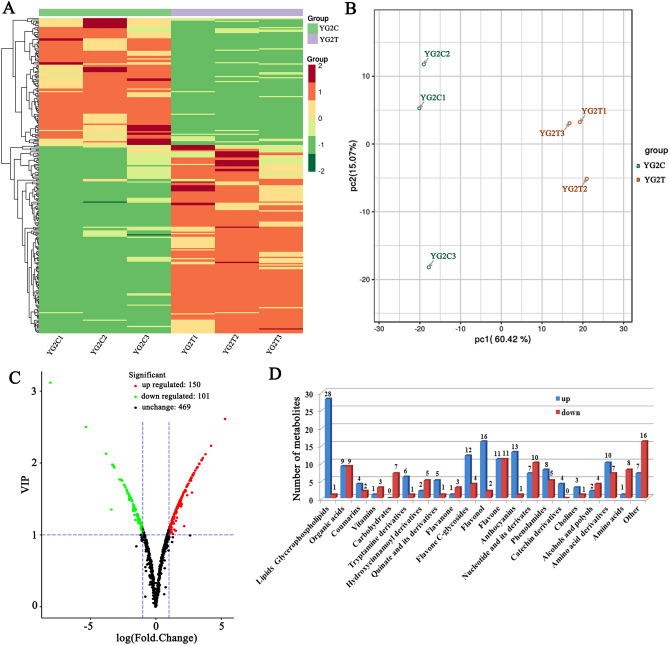
Figure 7.
Heat map visualization and PCA of differential metabolites in Yugu2. (A) Heat map visualization. The content of each metabolite was normalized to complete linkage hierarchical clustering. Each example indicated in a single column and each metabolite was showed by a single row. Green and red indicates the down-regulated and up-regulated metabolites, respectively. The color key scale indicated the abundance of metabolites. (B) Score plots for principle components 1 and 2 exhibited great cohesion within groups and good separation between control and salt treatments. (C) The volcano plot indicates the differential metabolites in Yugu2 before and after salt stress. (D) The number of differential metabolites in each class. Pheatmap package of R (v1.0.12, https://cran.r-project.org/web/packages/pheatmap/index.html) was used to create the (A). Ggplot package of R (v3.2.1, https://cran.r-project.org/web/packages/ggplot2/index.html) was used to create the (B). Ropls package of R (v1.18.8, https://bioconductor.org/packages/release/bioc/html/ropls.html)used to create the (C). Microsoft Office Excel (2007) used to create the (D).

