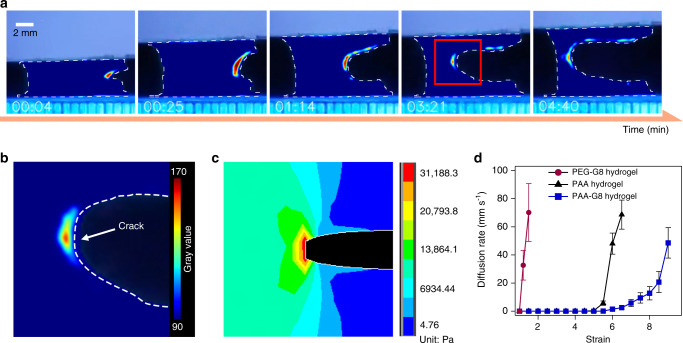
Fig. 4. Spatiotemporally visualizing the unfolding of polyprotein cross-linkers in the hydrogels.
a Fluorescence intensity images of the precut PAA-G8 hydrogel at different time points along stretching. The hydrogel was loaded with an environment-sensitive dye (ANS) whose fluorescence became brighter in hydrophobic environments. b Enlarged photo of the red region in a. The white dashed line indicates the crack edge. c Stress distribution of a stretched elastic hydrogel simulated using the finite element analysis method. The crack propagation site experienced the highest stress. d Crack diffusion rates under different constant strains for the PEG-G8 (purple circle), the PAA (black triangle), and the (blue square) PAA-G8 hydrogels. Error bars represent SD.

