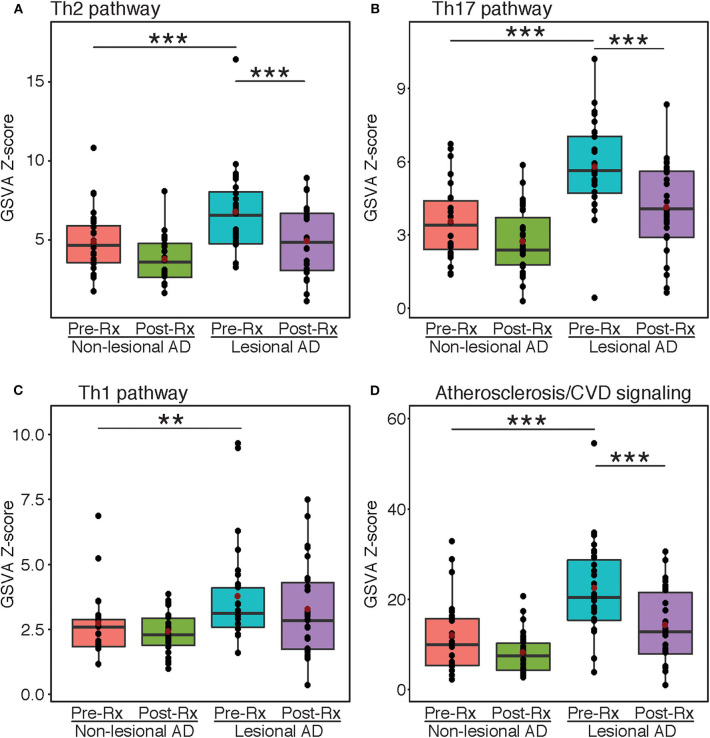
Figure 2.
Gene-set variation analysis. Mean z-scores of the Th2 (A), Th17 (B), Th1 (C), and atherosclerosis/cardiovascular risk (D) pathways in atopic dermatitis lesional and non-lesional tape-strips before and after dupilumb therapy, expressed as a boxplot. Red dots indicate mean values. Asterisks indicate significance between respective groups. AD, Atopic dermatitis; GSVA, Gene-set variation analysis; Rx, Treatment. ***FDR < 0.001, **FDR < 0.01.

