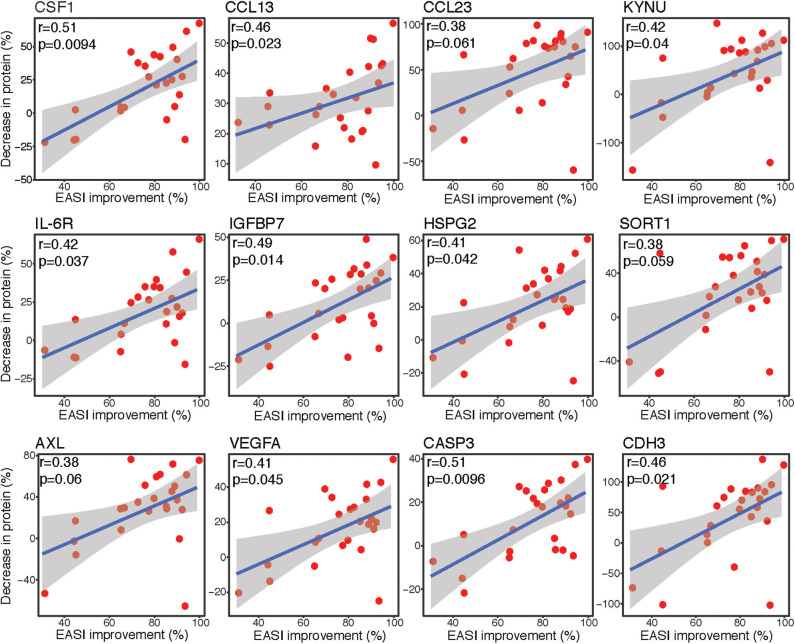
Figure 3.
Correlation plots. Spearman correlation scatter plots [linear regression [blue line] with its confidence interval [gray area]] for percent improvement in EASI score before and after dupilumab vs. percent decrease in protein expression levels, as measured by Olink. Upper left corner with r, Spearman correlation coefficient and p, associated P-value. EASI, Eczema Area and Severity Index.

