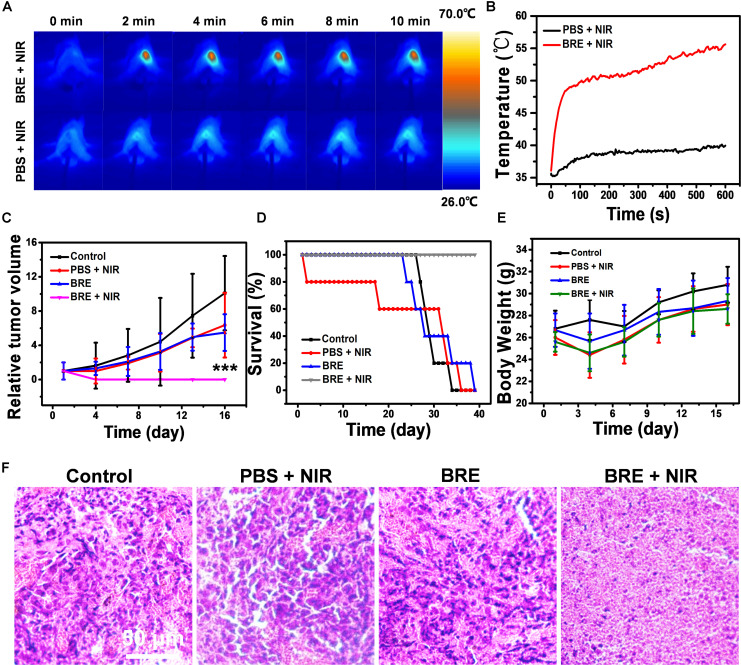
FIGURE 3.
The evaluation of in vivo anti-tumor effect. (A) Photothermal images and (B) temperature curves of BALB/c mice bearing 4T1 tumors irradiated with 808 nm for 10 min (1 W/cm2). (C) The relative tumor volume of different treatment groups. (D) The survival rate of different treatment groups. (E) The body weight of different treatment groups. (F) The tumor HE staining of different treatment groups. Data are presented as mean ± SD. ***P < 0.001.

