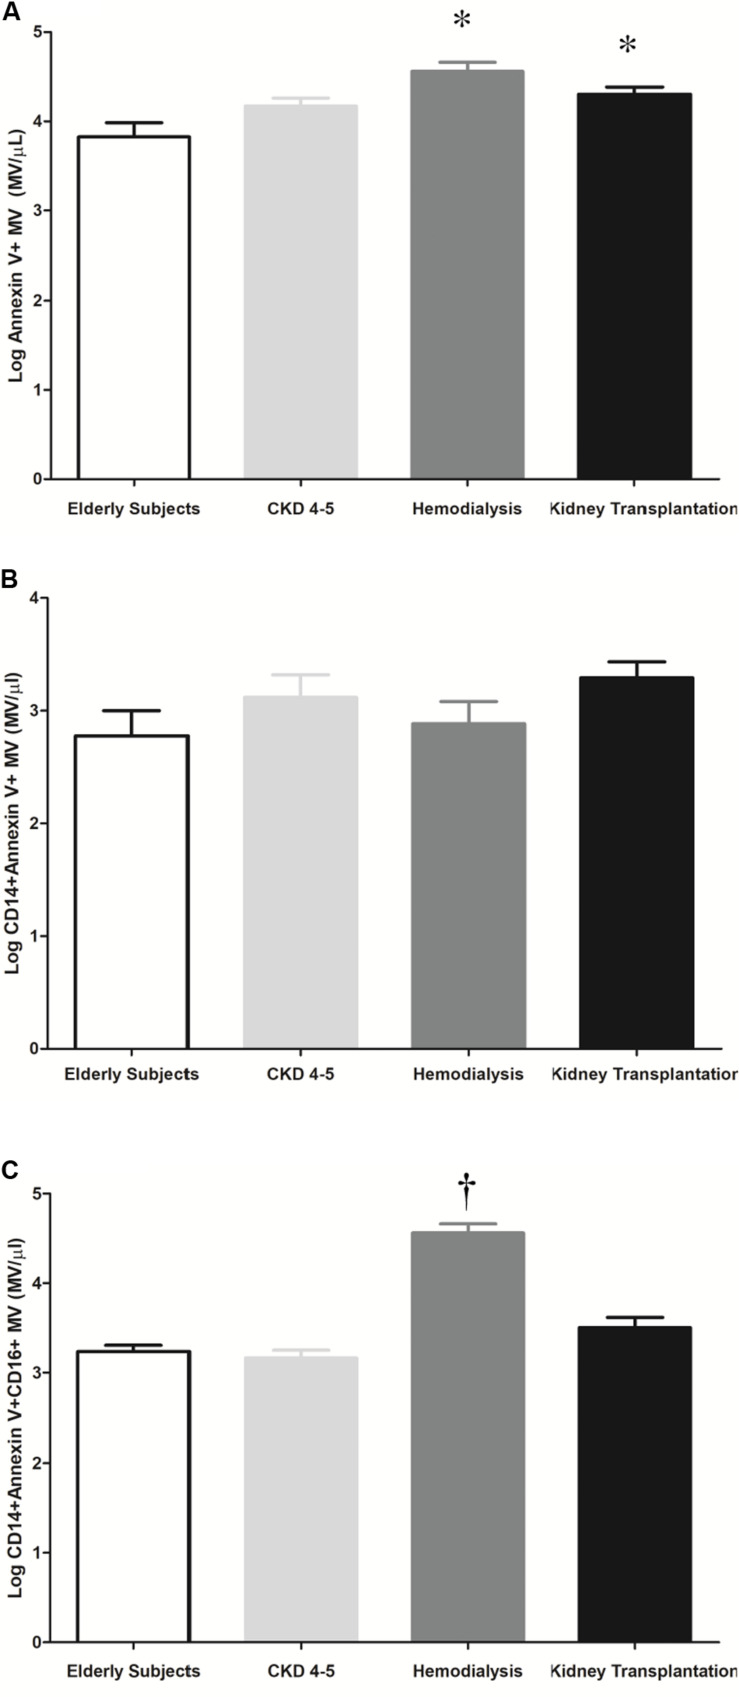
FIGURE 6.
Representative histogram and quantification of microvesicles (MV/μl) in plasma by flow cytometry. The results are represented as the means ± SEM. (A) Number of microvesicles per microliter (Log Annexin V + MV) in elderly subjects, CKD4-5, hemodialysis and kidney transplantation patients. (B) Number of microvesicles per microliter (Log CD14 + Annexin V + MV) in elderly subjects, CKD4-5, hemodialysis and kidney transplantation patients. (C) Number of microvesicles per microliter (Log CD14 + Annexin V + CD16 + MV) in elderly patients, CKD4-5, hemodialysis and kidney transplantation patients. The data were analyzed using an ANOVA test and Post hoc Bonferroni to evaluate statistical significance between groups. p-value < 0.05 was considered on the borderline of statistical significance. *p ≤ 0.03 vs. elderly subjects; †p < 0.001vs. all groups.

