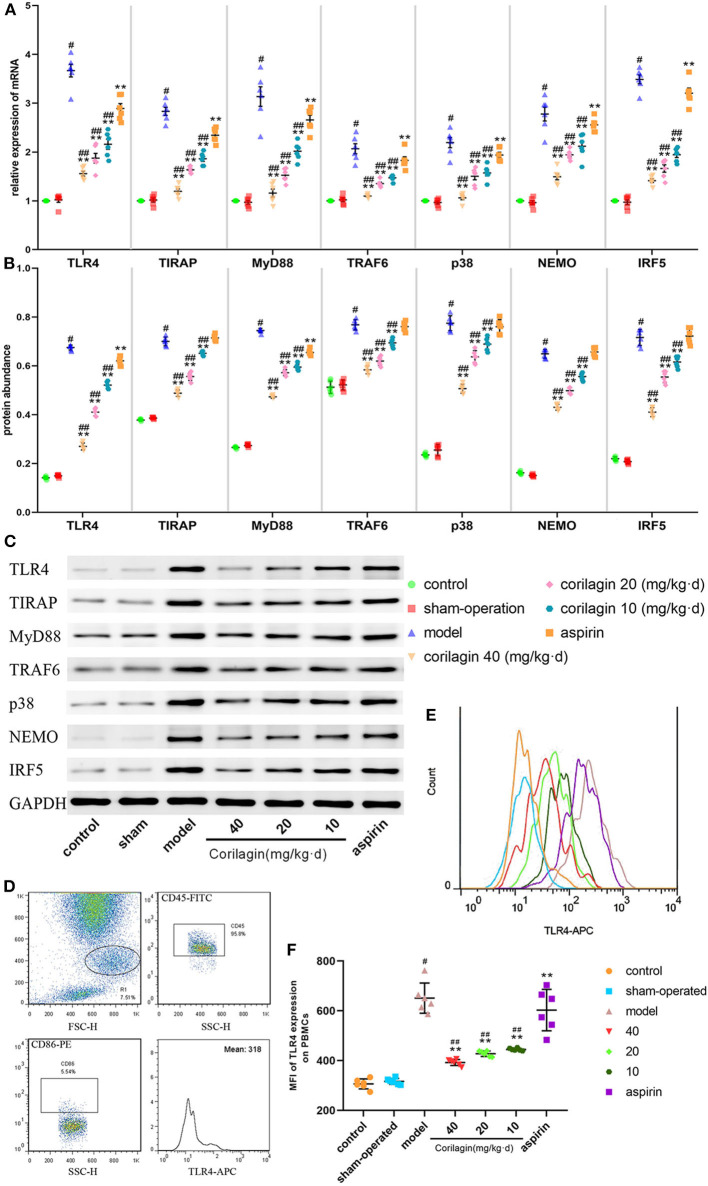
Figure 7.
Effect of corilagin on the TLR4 signaling pathway in PBMCs from a rat model of PAD. (A) mRNA expression of TLR4, TIRAP, MyD88, TRAF6, p38, NEMO, and IRF5 was measured by qRT-PCR. #P < 0.05 compared with the control group, **P < 0.05 compared with the model group, ##P < 0.05 compared with the aspirin group determined by one-way ANOVA and subsequent S–N–K method (n = 6). (B,C) Protein expression was measured by Western blotting. #P < 0.05 compared with control groups, **P < 0.05 compared with the model group, ##P < 0.05 compared with aspirin groups determined by one-way ANOVA and subsequent S–N–K method (n = 6). (D–F) TLR4 expression on PBMC membranes from a rat model of PAD tested by FCM. #P < 0.05 compared with the control group, **P < 0.05 compared with the model group, ##P < 0.05 compared with the aspirin group determined by one-way ANOVA and subsequent S-N-K method (n = 6).

