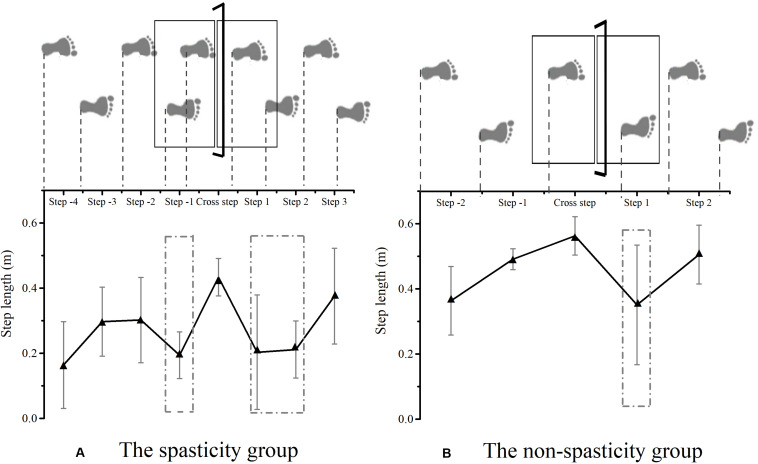
FIGURE 3.
Schematic explanation of step adjustments strategy among the spasticity group (A) and the non-spasticity group (B) during obstacle crossing. (A) The spasticity group; (B) the non-spasticity group; Mean values and standard deviation for each step in the two groups were plotted as black and gray lines, respectively. The dash-dotted rectangular area represents the location of step adjustment.

