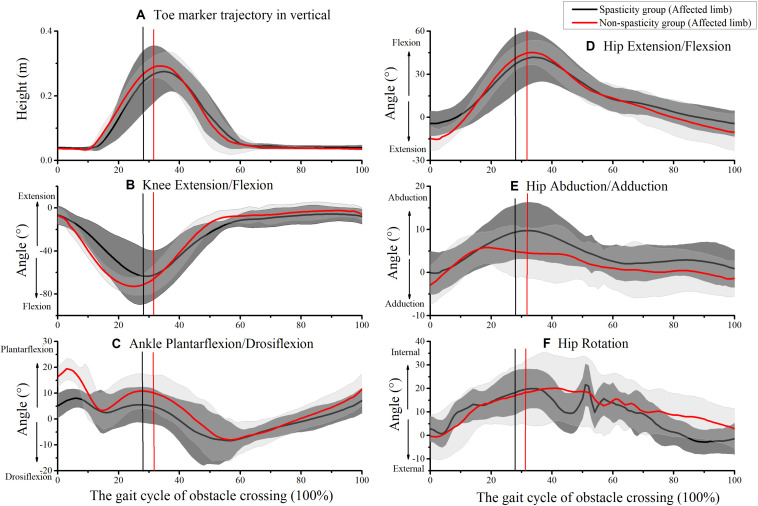
FIGURE 5.
Kinematics of affected-limb joints during obstacle crossing. (A) Toe marker vertical trajectory; (B) knee extension/flexion; (C) ankle plantarflexion/dorsiflexion; (D) hip extension/flexion; (E) hip abduction/adduction; (F) hip rotation. The mean times that the affected-limb toe was above the obstacle in the spasticity group (29.12 ± 4.44%) and the non-spasticity group (30.38 ± 2.48%) were plotted as black and red vertical lines, respectively.

