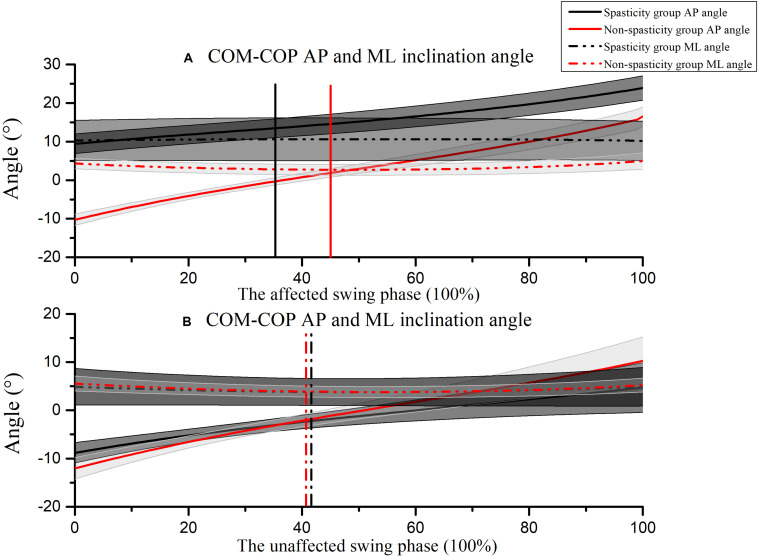
FIGURE 7.
COM-COP inclination angles during (A) the affected-limb swing phase, and (B) the unaffected-limb swing phase. Positive values indicate that the COM is in front of the COP. Toe-off and heel contact are indicated as 0 and 100%, respectively. The mean time that the affected-limb toe was above the obstacle in the spasticity group (35.47 ± 7.49%) and the non-spasticity group (45.41 ± 3.53%) were plotted as black and red vertical lines, respectively. The mean time that the unaffected-limb toe was above the obstacle in the spasticity group (41.08 ± 8.09%) and the non-spasticity group (40.96 ± 4.71%) were plotted as black and red vertical dash-dot lines, respectively.

