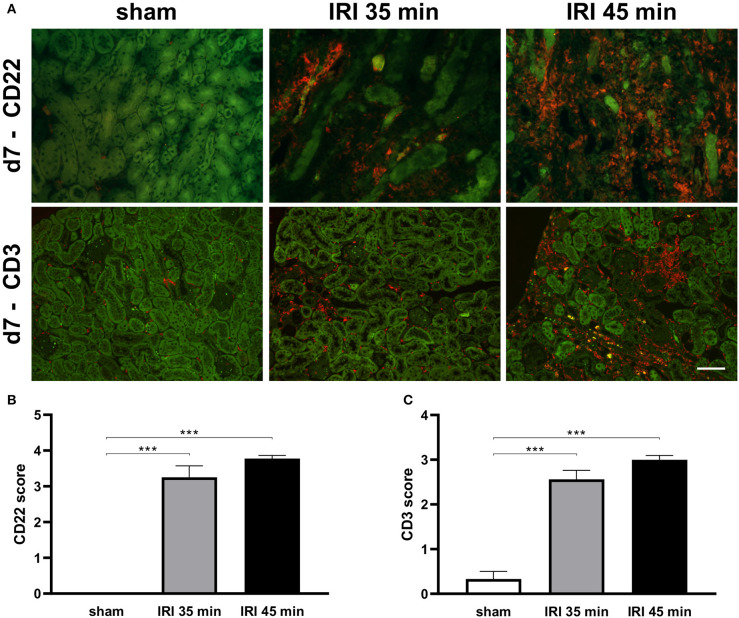
Figure 4.
B and T cell infiltration in kidney on day 7 after injury. Infiltration of B and T cells was determined on day 7 after injury. Representative images are shown in (A). Both renal IRI models led to significant increase levels of both cell types as determined by semi-quantitative scoring (B,C). No significant changes between different ischemia times were observed (bar: 100 μm, n = 6–8 mice per group, one-way ANOVA, ***p < 0.001).

