Figure 5.
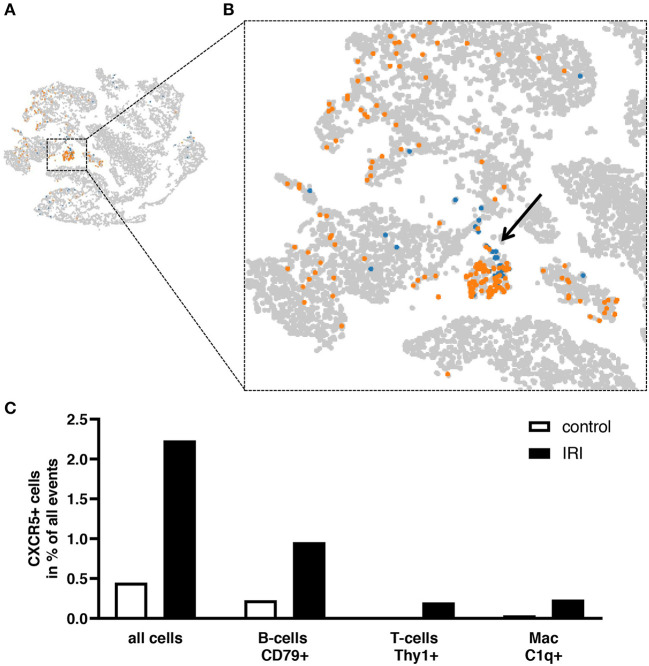
Detection of CXCR5+ cells in kidney tissue by sc-RNAseq. Sc-RNAseq data from three pooled control kidneys were compared to those from three pooled IRI kidneys 7 days after IRI. Expression of CXCR5 was increased after IRI (orange) compared to control (blue). Clusters of CXCR5 positive cells and scattered single cells were identified (B, enlarged view of A). The highest proportion of CXCR5+ cells were identified amongst CD79+ B-cells, followed by Thy1+ T-cells and C1qc+ macrophages (C).

