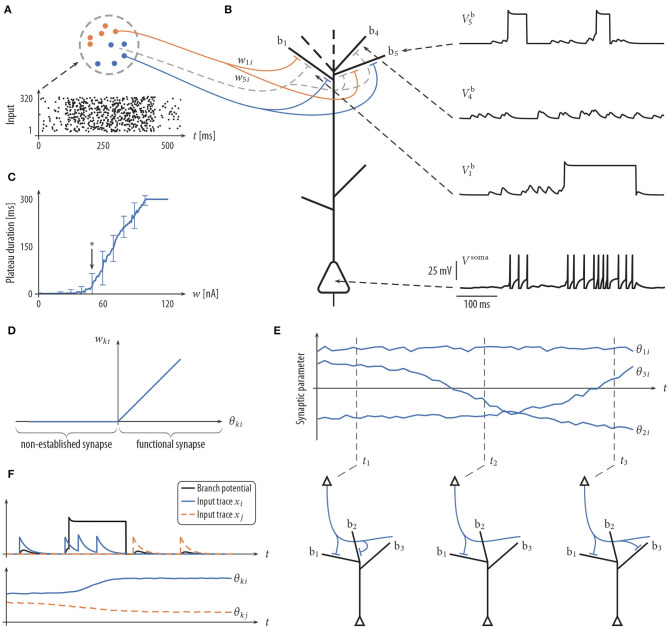
Figure 1.
Schema of neuron model and plasticity/rewiring. (A) Input neurons (colored dots) are divided into different input assemblies (2 shown; color indicates assembly assignment). Bottom: spike raster of input neurons. Dots represent spike times. (B) Schematic drawing of neuron model (spatial structure of branches for illustrative purposes only) with dendritic membrane potentials (top right) and somatic membrane potential Vsoma (bottom right). Branch b5 emits two dendritic spikes with a duration of about 50 ms. Branch b1 spikes once with a longer plateau phase. No synaptic cluster was established on branch b4. Therefore, this branch did not elicit dendritic spikes. Somatic spikes are indicated for illustrative purpose by vertical lines. (C) The duration of a plateau potential grows linearly as a function of the input intensity. The synaptic efficacy w of a single synaptic input was varied between 0 and 120 nA evenly spaced; a single strong synapse was used to mimic strong synchronous input. Shown is the mean and standard deviation of the resulting plateau durations over 100 independent trials. Arrow (at 50 nA) roughly marks the onset of this linear growth. Synaptic input exceeding this threshold has a fair chance of triggering a dendritic spike. (D) Mapping between the synaptic parameter θki and the synaptic efficacy wki of synapse i onto branch k. Negative values of θki, corresponding to non-established synapses, are mapped to zero in the wki-space. (E) Evolution of three synaptic parameters as a function of time t (top) and the corresponding wiring diagram at three points in time (bottom). At time t1 the values of parameters θ1i and θ2i are positive (indicating a functional synapse) while the value of parameter θ3i is negative (indicating a non-established synapse). Parameter θ2i crosses zero shortly before t2 (becoming non-established). (F) The plasticity process. Branch potential (black; sub-threshold potentials and a dendritic spike), the somatic spike traces of input neurons i and j (top), and the evolution of synaptic parameters θki and θkj (bottom). Input neuron i is active shortly before and during the dendritic spike. The synaptic parameter θki of this connection is therefore increasing. θkj decreases, since neuron j is not active during the plateau potential.

