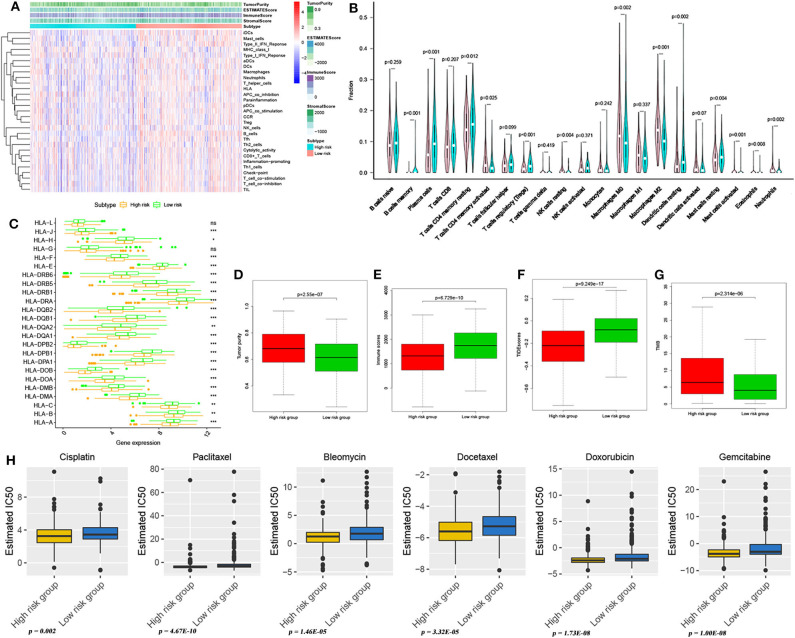
Figure 5.
Immune microenvironment landscape and prediction of immunotherapy and chemotherapy effect. (A) Immune microenvironment landscape exploration through ssGSEA methods in high- and low-risk patients. (B) The comparison of immune infiltration level between high- and low-risk patients, based on CIBERSORT. (C) HLA-related gene expression level in high- and low-risk group patients. *p < 0.05, **p < 0.01, and ***p < 0.001. The tumor purity difference (D) and immune score difference (E) between high- and low-risk patients. Differences in TIDE scores (F) and TMB (G) between patients in high- and low-risk groups. (H) Sensitivity analysis of six common chemotherapeutic drugs in patients at high and low risk.

