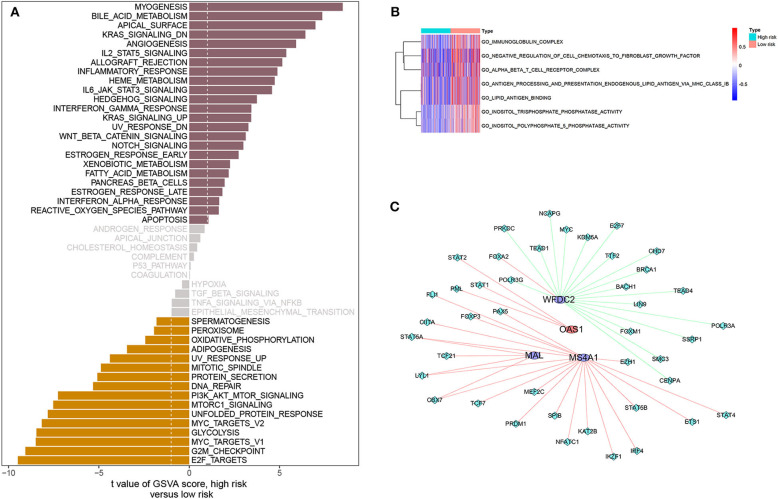
Figure 6.
Gene-set variation analysis and correlation between four immune-related genes and TFs. (A) Differences in pathway activities scored by GSVA between high- and low-risk patients. T values are shown from a linear model. We set |t| > 1 as a cutoff value. The pink column indicates activated pathways in high-risk patients, and the orange column indicates activated pathways in low-risk patients (DN, down; UV, ultraviolet; v1, version 1; v2, version 2). (B) Pathway enrichment analysis based on GO gene sets, including BP, CC, and MF, between high- and low-risk patients. |log2FC| > 0.2 was considered as a cutoff value. Red indicates activated pathways in low-risk patients, and blue indicates activated pathways in high-risk patients. (C) Network diagram of four immune-related genes interacting with TFs. The circles represent immune-related genes, where red is for high-risk genes and blue is for low-risk genes. Rhombus represents TFs. Red whip represents positive correlation, and green whip represents negative correlation.

