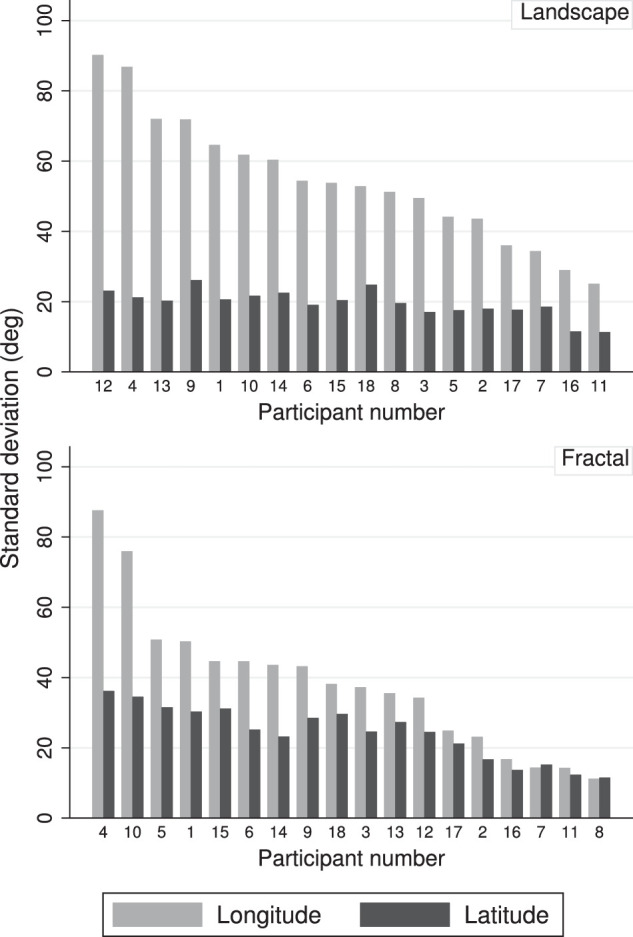
Figure 14.

Distribution of head spread by participant, for landscapes (top) and fractal scenes (bottom). The graphs show the standard deviations of latitude and longitude for the two scene types, separately for each participant. The bars are ordered by the size of the longitude standard deviation.
