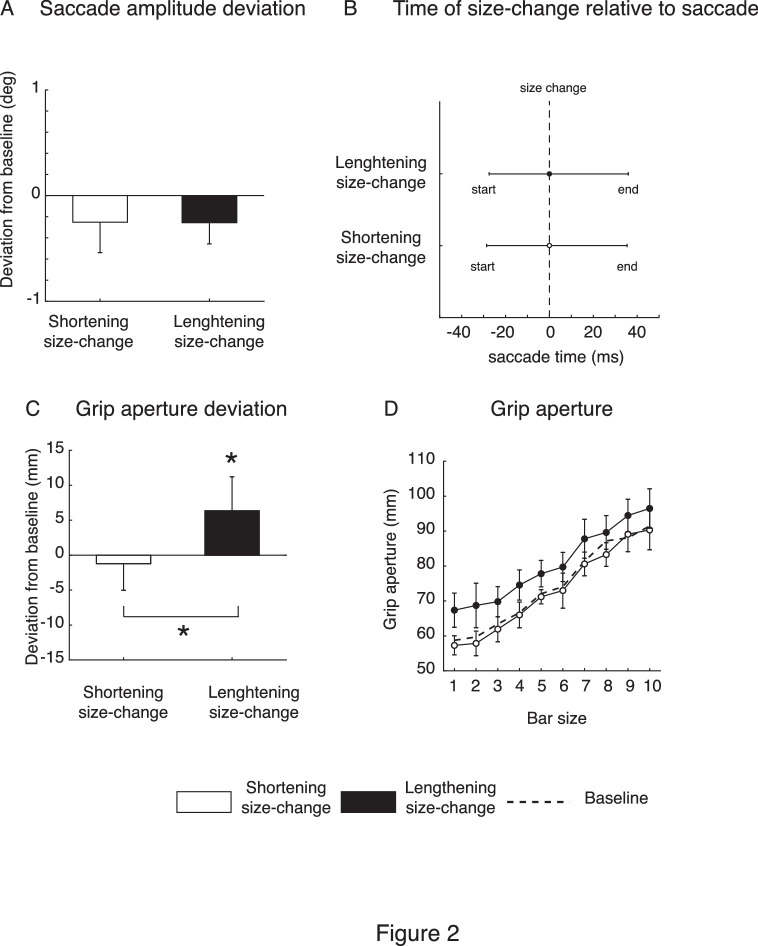
Figure 2.
(A) Mean deviation of saccade amplitude from baseline for the shortening size-change trials (white column) and the lengthening size-change trials (black column), averaged across participants and sizes. (B) Time of target size change presentation relative to the start and end of the saccade for the shortening (white dot) and lengthening (black dot) experiments. (C) Mean deviation of grip aperture from baseline for the shortening size-change trials (white column) and the lengthening size-change trials (black column) averaged across participants and sizes. (D) Distribution of mean post grip apertures for the shortening and lengthening size-change trials (white and black dots, respectively). Dotted line indicates the baseline (pre-grip apertures) averaged across shortening and lengthening sessions. Error bars indicate SE; *p < 0.05.

